 ianlancetaylor
commented
1 year ago
ianlancetaylor
commented
1 year ago CC @golang/runtime
Open Deleplace opened 1 year ago
ianlancetaylor
commented
1 year ago CC @golang/runtime
 prattmic
commented
1 year ago
prattmic
commented
1 year ago Thanks, I can reproduce this:
I modified the repo slightly to disable logging and turn it into a benchmark: https://github.com/Deleplace/pgo-test/compare/main...prattmic:deleplace-pgo-test:prattmic
I used 82 copies of https://en.wikipedia.org/wiki/File:Example.jpg as the input.
$ go test -bench=. -count=10 -args -concurrent=1 ./82images | tee before.txt
$ go test -bench=. -count=10 -cpuprofile=before.pprof -args -concurrent=1 ./82images
$ go test -bench=. -count=10 -pgo=before.pprof -args -concurrent=1 ./82images | tee after.txt
$ benchstat before.txt after.txt
goos: linux
goarch: amd64
pkg: github.com/Deleplace/pgo-test
cpu: Intel(R) Xeon(R) W-2135 CPU @ 3.70GHz
           │ before.txt  │             after.txt              │
           │   sec/op    │   sec/op     vs base               │
Process-12   299.0m ± 6%   320.1m ± 2%  +7.06% (p=0.001 n=10)
As an aside (I don't think this should affect PGO), your included profiles spend a lot of time in runtime.allocSpan -> runtime.sysUsed -> runtime.madvise. conc1_82.prof spends 44% of cycles in madvise! This might be #36603? (cc @mknyszek) (My profile doesn't show any time in madvise, but I'm on Linux, not Darwin)
 mknyszek
commented
1 year ago
mknyszek
commented
1 year ago Thinking about this more, I think it's actually a Darwin-specific issue where newly-mapped memory has sysUsed called on it, but it's unnecessary (and maybe even incorrect). My best guess is Darwin is going down some slow error path. :( That would make this distinct from https://github.com/golang/go/issues/36603.
If I'm right, what's really annoying is Darwin goes against every other platform in this respect, where we want to sysUsed every time we access not-paged-in memory except the first time.
prattmic
commented
1 year ago My before/after profiles (for 10x runs of the benchmark): profiles.tar.gz
After PGO, the benchmark takes ~3 cpu-s extra. ~2 of those are from flate.(*compressor).deflate, which had flate.(*compressor).findMatch inlined due to PGO.
I haven't looked closely yet, but I'm guessing inlining has some bad effects on further optimizations which result in a worse output.
 Deleplace
commented
1 year ago
Deleplace
commented
1 year ago Thanks Michael and Michael, I wasn't aware yet that (1) Darwin was special here and (2) inlining could have bad effects on performance, besides increasing the binary size.
Deleplace
commented
1 year ago @mknyszek I relaunched my original scripts on Linux amd64, and observed the same ~5% perf loss. My best guess is that the cause is not specific to Darwin.
Deleplace
commented
1 year ago @prattmic I can confirm your awesome findings on my Linux amd64:
flate.(*compressor).deflatefindMatch, only after PGOfindMatch has a cost 208, which exceeds the standard budget 80 but may still be get inlined thanks to PGO.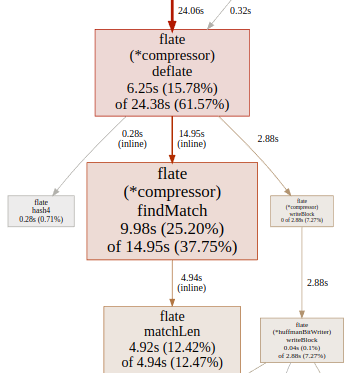
The binary size after PGO remains almost the same, it does not seem that inlining has occurred recklessly at too many call sites.
We do seem to spend 200% of normal time inside matchLen. matchLen has always been inlined, but it could be that the extra upstream inlining of findMatch drives it confused about either BCE (bound check elimination), or about some magical decision to pass slice contents as arguments by ref or by value, given that the slice args are only read, not written to.
mknyszek
commented
1 year ago To be clear, what I mentioned has nothing to do with PGO; Darwin isn't special for PGO. I was just investigating something else that looked off in the profile you provided.
prattmic
commented
1 year ago I spent a while today looking at profiles and binary diffs (which was fun!) for deflate/findMatch.
In summary:
if conditions in the loop body are false.
if in the loop taken, and then the hot portion is this loop in the matchLen call.
matchLen is inlined both before and after PGO.findMatch loop.findMatch loop:
Before:
Samples|
   624 │ c5:   mov    0x28(%rsp),%rcx
   676 │       dec    %rcx
       │     return
   660 │       mov    %r11,0x58(%rsp)
       │     for i := prevHead; tries > 0; tries-- {
   664 │       mov    %rcx,%r11
       │     if wEnd == win[i+length] {
   660 │       mov    %r15,%rcx
       │     // matchLen returns the number of matching bytes in a and b
       │     // up to length 'max'. Both slices must be at least 'max'
       │     // bytes in size.
       │     func matchLen(a, b []byte, max int) int {
       │     a = a[:max]
       │     b = b[:len(a)]
   659 │       mov    0x20(%rsp),%r15
       │     compress/flate.matchLen():
   673 │       nop
       │     compress/flate.(*compressor).findMatch():
       │     for i := prevHead; tries > 0; tries-- {
   681 │ e0:   test   %r11,%r11
   650 │     ↓ jle    170
   666 │       mov    %r11,0x28(%rsp)
       │     if wEnd == win[i+length] {
   654 │       lea    (%rcx,%rdi,1),%r11
   672 │       cmp    %r9,%r11
   678 │     ↓ jae    2b1
   646 │       movzbl (%r8,%r11,1),%r11d
   664 │       cmp    %r10b,%r11b
   692 │     ↓ jne    13f
...
   652 │13f:   mov    0x58(%rsp),%r11
       │     if i == minIndex {
   670 │144:   cmp    %rsi,%rcx
   691 │     ↓ je     194
       │     i = int(d.hashPrev[i&windowMask]) - d.hashOffset
   655 │       and    $0x7fff,%ecx
   688 │       mov    0x80068(%rax,%rcx,4),%r15d
   627 │       sub    0xa0068(%rax),%r15
   696 │       xchg   %ax,%ax
       │     if i < minIndex || i < 0 {
   622 │       cmp    %rsi,%r15
   655 │     ↓ jl     18a
   690 │       test   %r15,%r15
   679 │     ↑ jge    c5
After:
Samples|
   722 │4b1bde:   dec    %rdi
       │       compress/flate.(*compressor).deflate():
       │       if newLength, newOffset, ok := d.findMatch(d.index, d.chainHead-d.hashOffset, minMatchLength-1, lookahead); ok {
   638 │4b1be1:   mov    %r11,0x88(%rsp)
   653 │4b1be9:   mov    %r8,0x70(%rsp)
       │       if b[i] != av {
   618 │4b1bee:   mov    0xd8(%rsp),%r8
       │       compress/flate.(*compressor).findMatch():
       │       if n > length && (n > minMatchLength || pos-i <= 4096) {
   700 │4b1bf6:   mov    0xc8(%rsp),%r11
   680 │4b1bfe:   xchg   %ax,%ax
       │       for i := prevHead; tries > 0; tries-- {
   658 │4b1c00:   test   %rdi,%rdi
   684 │4b1c03: ↓ jle    4b1ccb <compress/flate.(*compressor).deflate+0xa0b>
       │       if wEnd == win[i+length] {
   644 │4b1c09:   mov    0x88(%rsp),%r11
   667 │4b1c11:   lea    0x0(%r13,%r11,1),%r8
   700 │4b1c16:   cmp    %r10,%r8
   681 │4b1c19: ↓ jae    4b1e86 <compress/flate.(*compressor).deflate+0xbc6>
   699 │4b1c1f:   movzbl (%r8,%r12,1),%r8d
   619 │4b1c24:   cmp    %r9b,%r8b
   663 │4b1c27: ↓ jne    4b1c9b <compress/flate.(*compressor).deflate+0x9db>
...
   591 │4b1c9b:   mov    0x70(%rsp),%r8
       │       compress/flate.(*compressor).findMatch():
       │       if i == minIndex {
   640 │4b1ca0:   cmp    %rcx,%r13
   656 │4b1ca3: ↓ je     4b1d0a <compress/flate.(*compressor).deflate+0xa4a>
       │       i = int(d.hashPrev[i&windowMask]) - d.hashOffset
   724 │4b1ca5:   and    $0x7fff,%r13d
   668 │4b1cac:   mov    0x80068(%rax,%r13,4),%r13d
   705 │4b1cb4:   sub    %r15,%r13
       │       if i < minIndex || i < 0 {
   595 │4b1cb7:   cmp    %rcx,%r13
   633 │4b1cba: ↓ jl     4b1cfd <compress/flate.(*compressor).deflate+0xa3d>
   625 │4b1cbc:   nopl   0x0(%rax)
   713 │4b1cc0:   test   %r13,%r13
   688 │4b1cc3: ↑ jge    4b1bde <compress/flate.(*compressor).deflate+0x91e>
matchLen loop:
Before:
Samples|
   358 │19e:   inc    %r11
       │     compress/flate.(*compressor).findMatch():
       │     if i == minIndex {
   344 │       mov    0x38(%rsp),%rsi
       │     compress/flate.matchLen():
       │     b = b[:len(a)]
   358 │       mov    0x20(%rsp),%r15
       │     for i, av := range a {
   394 │1ab:   cmp    %r12,%r11
   366 │     ↓ jge    1d4
   384 │       movzbl (%r11,%r13,1),%r15d
       │     if b[i] != av {
   413 │       movzbl (%r11,%rdx,1),%esi
   400 │       cmp    %r15b,%sil
   381 │     ↑ je     19e
After:
Samples|
   322 │4b1d17:   lea    0x1(%r15),%r12
       │       compress/flate.(*compressor).findMatch():
       │       wEnd = win[pos+n]
   330 │4b1d1b:   mov    0x50(%rsp),%r10
       │       if n > length && (n > minMatchLength || pos-i <= 4096) {
   336 │4b1d20:   mov    0x90(%rsp),%r13
       │       compress/flate.matchLen():
       │       b = b[:len(a)]
   343 │4b1d28:   mov    0x60(%rsp),%r15
       │       for i, av := range a {
   365 │4b1d2d:   mov    %r12,0x48(%rsp)
       │       compress/flate.(*compressor).findMatch():
       │       wEnd = win[pos+n]
   354 │4b1d32:   mov    0xd0(%rsp),%r12
       │       compress/flate.matchLen():
       │       for i, av := range a {
   373 │4b1d3a:   mov    0x48(%rsp),%r15
   413 │4b1d3f:   nop
   354 │4b1d40:   cmp    %rdx,%r15
   368 │4b1d43: ↓ jge    4b1d79 <compress/flate.(*compressor).deflate+0xab9>
   414 │4b1d45:   movzbl (%r15,%r8,1),%r12d
       │       if b[i] != av {
   379 │4b1d4a:   mov    0xd8(%rsp),%r10
   373 │4b1d52:   movzbl (%r15,%r10,1),%r13d
   399 │4b1d57:   cmp    %r12b,%r13b
411 │4b1d5a: ↑ je 4b1d17 <compress/flate.(*compressor).deflate+0xa57>At a high level, I'll say that this application isn't a great fit for PGO today because it isn't "diverse" enough. That is, it spends almost all of its time in a very small number of functions. Right now, PGO works best with programs with hundreds of hot functions, allowing it to accumulate small wins from many places.
That said, we've said that we don't want PGO causing regressions, so I still would like to get this back closer to no regression.
prattmic
commented
1 year ago I suspect that the second bullet above (the matchLen loop) would be more-or-less resolved if we hoisted the spill load/stores out of the loop (is this in scope of #15808?).
The profile does not should the entry to matchLen as hot, which implies that this loop typically has many iterations which could amortize the cost of loading several stack values beforehand.
 randall77
commented
1 year ago
randall77
commented
1 year ago Yes, that's basically #15808.
prattmic
commented
1 year ago I spent more time on this today. While hoisting could perhaps help here, the ultimate problem seems to be completely useless loads.
Here is the final assembly of the core loop:
v588 00539 (+320) INCQ R10
v1091 00540 (256) MOVBLZX compress/flate.wEnd-150(SP), R12
v1096 00541 (267) MOVQ compress/flate.win.len-136(SP), R15
v734 00542 (320) MOVQ R10, compress/flate.~R0-144(SP)
v891 00543 (319) MOVQ compress/flate.wPos.cap-120(SP), R10
// end of b103
v481 00544 (+320) MOVQ compress/flate.~R0-144(SP), R10
v343 00545 (320) CMPQ R10, R9
     00546 (320) JGE 556
// end of b101
v574 00547 (320) MOVBLZX (R10)(R11*1), R15
v214 00548 (+321) MOVBLZX (R10)(R8*1), R12
v337 00549 (321) CMPB R12, R15
     00550 (321) JEQ 539
// end of b107
The loads of R12, R15, and R10 at 540, 541, and 543 are useless; they are never used. In this analysis I looked specifically at the R10 load which is obviously useless without any extra context, as it is immediately overwritten by the next instruction.
Why are we loading this?
Here are the basic blocks after regalloc:
b101: ← b99 b103
  v565 (320) = Phi <int> v941 v734 : ~R0[int] (i[int], ~R0[int])
  v481 (320) = LoadReg <int> v565 : R10
  v343 (+320) = CMPQ <flags> v481 v976
LT v343 → b107 b104 (likely) (320)

b107: ← b101
  v574 (320) = MOVBloadidx1 <byte> v481 v531 v847 : R15 (av[byte])
  v214 (321) = MOVBloadidx1 <uint8> v481 v494 v847 : R12
  v337 (+321) = CMPB <flags> v214 v574
NE v337 → b106 b103 (unlikely) (321)

b103: ← b107
  v588 (+320) = ADDQconst <int> [1] v481 : R10
  v1091 (256) = LoadReg <byte> v489 : R12
  v1096 (267) = LoadReg <int> v482 : R15
  v734 (320) = StoreReg <int> v588 : ~R0[int]
  v891 (319) = LoadReg <int> v1187 : R10
Plain → b101 (320)
And just before regalloc:
b101: ← b99 b103
  v565 (320) = Phi <int> v926 v588 (~R0[int], i[int])
  v343 (+320) = CMPQ <flags> v565 v416
LT v343 → b107 b104 (likely) (320)

b107: ← b101
  v574 (320) = MOVBloadidx1 <byte> v565 v531 v847 (av[byte])
  v214 (321) = MOVBloadidx1 <uint8> v565 v494 v847
  v337 (+321) = CMPB <flags> v214 v574
NE v337 → b106 b103 (unlikely) (321)

b103: ← b107
  v588 (+320) = ADDQconst <int> [1] v565
Plain → b101 (320)
(I've omitted b101 predecessor b99, but you can see it in the screenshot).
From this diff it isn't clear why b103 adds a load to R10. We can get more context from -gcflags=compress/flate=-d=ssa/regalloc/debug=100:
edge b103->b101
...
src R10: v588 cache=v588
...
dst R10: v490
...
moving v588 to ~R0[int]
sources of v588: R10:v588 [use R10]
v734 = StoreReg <int> v588 : ~R0[int]
v588 now available in ~R0[int]:v734
moving v490 to R10
sources of v490: wPos.cap[int]:v1187 [use wPos.cap[int]]
v588 no longer available in R10:v588
v891 = LoadReg <int> v1187 : R10
v490 now available in R10:v891
This says that on entry (src) this block has v588 in R10, and on exit (dst), it should have v490 in R10. Thus v588 gets spilled to the stack and v490 is loaded from its stack slot (v490 happens to be the capacity of b).
Why does this block think it needs v490 in R10? The expected dst values come from the src values of the successor block. Taking a look at successor b101, we see:
Begin processing block b101
...
starting merge block b101 with end state of b99:
...
  R10: orig:v490 cache:v1138
...
value v343 = CMPQ <flags> v565 v416
  out:
  in0:
  in1: CX
freeReg R10 (dump v490/v1138)
assignReg R10 v565/v481
...
live-at-end spill for v490 at b101
b101 wants v490 in R10 on entry because its other predecessor b99 ends with v490 in R10 (because b99's predecessor b95 loaded it into R10. You can see this in the image).
However, b101 proceeds to immediately dump v490 and use R10 for its own purpose. Note that b101 doesn't need to write R10 back to the v490 stack slot (v1138). I think this is because at this point every SSA value still has its own "stack slot", so SSA semantics still apply, but I'm not certain.
It seems to me that it should be possible for regalloc to remove R10 from its requested src state if it knows it will dump the register without needing a spill store.
cc @dr2chase
 gopherbot
commented
1 year ago
gopherbot
commented
1 year ago Change https://go.dev/cl/471158 mentions this issue: cmd/compile/internal/ssa: drop overwritten regalloc basic block input requirements
gopherbot
commented
1 year ago Change https://go.dev/cl/484215 mentions this issue: cmd/compile: expose ir.Func to ssa
prattmic
commented
1 year ago https://go.dev/cl/471158 targeted one of the problems in this workload, but it didn't make a huge difference.
Here is the current status:
goos: linux
goarch: amd64
pkg: github.com/Deleplace/pgo-test
cpu: Intel(R) Xeon(R) W-2135 CPU @ 3.70GHz
           │ 120_nopgo.txt │           121_nopgo.txt            │            120_pgo.txt             │            121_pgo.txt             │
           │    sec/op     │   sec/op     vs base               │   sec/op     vs base               │   sec/op     vs base               │
Process-12     294.8m ± 1%   287.2m ± 1%  -2.57% (p=0.000 n=10)   319.9m ± 1%  +8.51% (p=0.000 n=10)   310.6m ± 1%  +5.38% (p=0.000 n=10)
Comparing just 1.21, we see there is still ~8% regression with PGO:
goos: linux
goarch: amd64
pkg: github.com/Deleplace/pgo-test
cpu: Intel(R) Xeon(R) W-2135 CPU @ 3.70GHz
           │ 121_nopgo.txt │            121_pgo.txt             │
           │    sec/op     │   sec/op     vs base               │
Process-12 287.2m ± 1% 310.6m ± 1% +8.16% (p=0.000 n=10)Thank you Michael
What version of Go are you using (
go version)?Does this issue reproduce with the latest release?
Yes
What operating system and processor architecture are you using (
go env)?go envOutputWhat did you do?
I wanted to try the amazing PGO (Profile Guided Optimization) new capability of Go 1.20.
For this I wrote a program that converts all JPEG files in a directory into PNG. It is mostly CPU/memory-bound, with some I/O to read and write the local filesystem.
I wanted to observe:
I tried 6 settings: {sequential, concurrent} x process {3, 10, 82} images.
Source at https://github.com/Deleplace/pgo-test
To create the 6 profiles easily, I executed
main()inside a test:To create the 6 PGO-optimized executables:
What did you expect to see?
What did you see instead?
The PGO-enabled programs always seem a bit slower than the original program, regardless of the exact inputs used to produce the profiles.