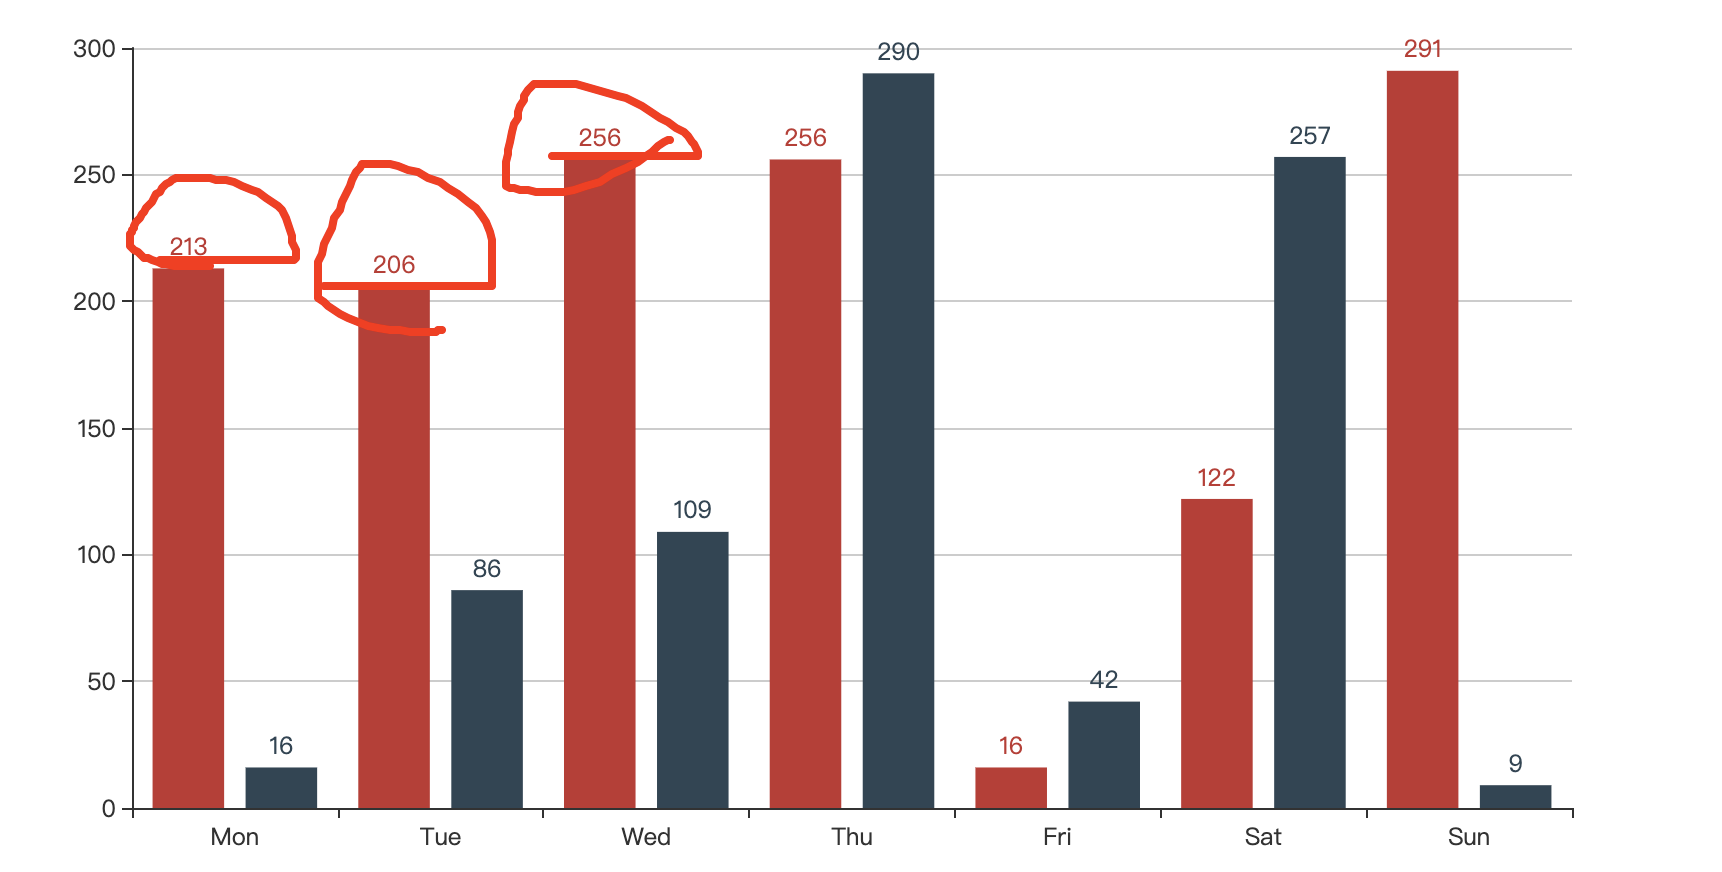
or like this

not like this

Closed fengjiansunren closed 3 years ago
or like this

not like this

Could you try this code below? It generates the graph shown in the first figure.

''''go
package main

import (
"fmt"
"image/color"
"log"
"math"
"strconv"

"gonum.org/v1/plot"
"gonum.org/v1/plot/plotter"
"gonum.org/v1/plot/vg"
)

type integerTicks struct{}

func (integerTicks) Ticks(min, max float64) []plot.Tick {
    var t []plot.Tick
    for i := math.Trunc(min); i <= max; i += 50 {
     t = append(t, plot.Tick{Value: i, Label: fmt.Sprint(i)})
  }
return t
}

func main() {
red := plotter.Values{213, 206, 256, 256, 16, 122, 291}
black := plotter.Values{16, 86, 109, 290, 42, 257, 9}

days := []string{"Mon", "Tue", "Wed", "Thu", "Fri", "Sat", "Sun"}

p, err := plot.New()
if err != nil {
    panic(err)
}

redC := color.RGBA{R: 255, A: 255}
blackC := color.RGBA{R: 196, G: 196, A: 255}

w := vg.Points(8)

redBars, err := plotter.NewBarChart(red, w)
if err != nil {
    panic(err)
}
redBars.Color = redC
redBars.Offset = -w

blackBars, err := plotter.NewBarChart(black, w)
if err != nil {
    panic(err)
}
blackBars.Color = blackC
blackBars.Offset = w

p.Add(blackBars, redBars)
p.NominalX(days...)

var redLabels []string
var blackLabels []string

for i := range red {
    rLabel := strconv.FormatFloat(red[i], 'f', -1, 64)
    bLabel := strconv.FormatFloat(black[i], 'f', -1, 64)

    redLabels = append(redLabels, rLabel)
    blackLabels = append(blackLabels, bLabel)
}

var xysR, xysB []plotter.XY

for i := range red {
    rxPos, bxPos := float64(i)-0.5, float64(i)+0.1
    ryPos, byPos := red[i]+5, black[i]+5

    rXY := plotter.XY{X: rxPos, Y: ryPos}
    bXY := plotter.XY{X: bxPos, Y: byPos}

    xysR = append(xysR, rXY)
    xysB = append(xysB, bXY)
}

rl, err := plotter.NewLabels(plotter.XYLabels{
    XYs:    xysR,
    Labels: redLabels,
},
)
if err != nil {
    log.Fatalf("could not creates labels plotter: %+v", err)
}
for i := range rl.TextStyle {
    rl.TextStyle[i].Color = color.RGBA{R: 255, A: 255}
    //fmt.Println(r, i)
}

bl, err := plotter.NewLabels(plotter.XYLabels{
    XYs:    xysB,
    Labels: blackLabels,
},
)
if err != nil {
    log.Fatalf("could not creates labels plotter: %+v", err)
}

var t []plot.Tick
for i := math.Trunc(0); i <= 300; i += 50 {
    t = append(t, plot.Tick{Value: i, Label: fmt.Sprint(i)})
}
p.Y.Max = 310
p.Y.Tick.Marker = integerTicks{}

p.Add(rl, bl)

if err := p.Save(4*vg.Inch, 4*vg.Inch, "points.png"); err != nil {
    panic(err)
}
} ''''
@sbinet Is the horizontal axis line left out by default for category plots like above?
It would seem that, indeed, 'NominalX' hides the x axis: https://github.com/gonum/plot/blob/master/plot.go#L399
(See the width=0 and other lines, that are in effect equivalent to 'HideX')
I agree it's debatable as to whether it's a fine default behaviour.
Thanks for the example, BTW. While it's not exactly (I guess) the rendering the OP probably wanted, I guess it's a fine start.
One could imagine packaging this into a custom plotter. (And add the drawing of the little bullet).
Could you try this code below? It generates the graph shown in the first figure.
''''go
package main

import (
"fmt"
"image/color"
"log"
"math"
"strconv"

"gonum.org/v1/plot"
"gonum.org/v1/plot/plotter"
"gonum.org/v1/plot/vg"
)

type integerTicks struct{}

func (integerTicks) Ticks(min, max float64) []plot.Tick {
    var t []plot.Tick
    for i := math.Trunc(min); i <= max; i += 50 {
   t = append(t, plot.Tick{Value: i, Label: fmt.Sprint(i)})
  }
return t
}

func main() {
red := plotter.Values{213, 206, 256, 256, 16, 122, 291}
black := plotter.Values{16, 86, 109, 290, 42, 257, 9}

days := []string{"Mon", "Tue", "Wed", "Thu", "Fri", "Sat", "Sun"}

p, err := plot.New()
if err != nil {
  panic(err)
}

redC := color.RGBA{R: 255, A: 255}
blackC := color.RGBA{R: 196, G: 196, A: 255}

w := vg.Points(8)

redBars, err := plotter.NewBarChart(red, w)
if err != nil {
  panic(err)
}
redBars.Color = redC
redBars.Offset = -w

blackBars, err := plotter.NewBarChart(black, w)
if err != nil {
  panic(err)
}
blackBars.Color = blackC
blackBars.Offset = w

p.Add(blackBars, redBars)
p.NominalX(days...)

var redLabels []string
var blackLabels []string

for i := range red {
  rLabel := strconv.FormatFloat(red[i], 'f', -1, 64)
  bLabel := strconv.FormatFloat(black[i], 'f', -1, 64)

  redLabels = append(redLabels, rLabel)
  blackLabels = append(blackLabels, bLabel)
}

var xysR, xysB []plotter.XY

for i := range red {
  rxPos, bxPos := float64(i)-0.5, float64(i)+0.1
  ryPos, byPos := red[i]+5, black[i]+5

  rXY := plotter.XY{X: rxPos, Y: ryPos}
  bXY := plotter.XY{X: bxPos, Y: byPos}

  xysR = append(xysR, rXY)
  xysB = append(xysB, bXY)
}

rl, err := plotter.NewLabels(plotter.XYLabels{
  XYs:    xysR,
  Labels: redLabels,
},
)
if err != nil {
  log.Fatalf("could not creates labels plotter: %+v", err)
}
for i := range rl.TextStyle {
  rl.TextStyle[i].Color = color.RGBA{R: 255, A: 255}
  //fmt.Println(r, i)
}

bl, err := plotter.NewLabels(plotter.XYLabels{
  XYs:    xysB,
  Labels: blackLabels,
},
)
if err != nil {
  log.Fatalf("could not creates labels plotter: %+v", err)
}

var t []plot.Tick
for i := math.Trunc(0); i <= 300; i += 50 {
  t = append(t, plot.Tick{Value: i, Label: fmt.Sprint(i)})
}
p.Y.Max = 310
p.Y.Tick.Marker = integerTicks{}

p.Add(rl, bl)

if err := p.Save(4*vg.Inch, 4*vg.Inch, "points.png"); err != nil {
  panic(err)
}
} ''''
thanks
What are you trying to do?
i want to show label value like this
What did you do?
i don't konw how to do this, i did't find this example in the examples
can anybody help me solve this