Closed AnderEnder closed 5 years ago
the profile only accounts for a 150MB heap, e.g. was taken when relay-ng had a very healthy memory usage. there might be a legitimate issue here but it's easy to draw the wrong conclusions from this profile.
is it possible to get a profile of when memory usage was into the problematic area? ideally we integrate https://github.com/Dieterbe/profiletrigger and then you can set it up to automatically trigger a heap profile when the heap reaches a certain treshold. would you be willing to contribute this?
I left the the app for about 2.5 hours:
version by "git describe": v0.9.2-5-g37e9ca8
Part of startup log
10:56:32.127787 ▶ NOTI listening on 0.0.0.0:2203/tcp
10:56:32.128017 ▶ NOTI listening on 0.0.0.0:2203/udp
10:56:32.128280 ▶ NOTI listening on 0.0.0.0:2204/tcp
10:56:32.128514 ▶ NOTI listening on 0.0.0.0:2204/udp
10:56:32.128917 ▶ NOTI admin TCP listener starting on 127.0.0.1:8204
10:56:32.132685 ▶ NOTI admin HTTP listener starting on 127.0.0.1:8082
10:58:32.004443 ▶ NOTI conn localhost:2003 .conn.Read returned EOF -> conn is closed. closing conn explicitly
10:58:32.034416 ▶ NOTI conn localhost:2003 .conn.Read returned EOF -> conn is closed. closing conn explicitly
10:58:32.047374 ▶ NOTI conn localhost:2003 .conn.Read returned EOF -> conn is closed. closing conn explicitly
10:58:32.053957 ▶ NOTI conn localhost:2003 .conn.Read returned EOF -> conn is closed. closing conn explicitly
10:58:32.071024 ▶ NOTI conn localhost:2003 .conn.Read returned EOF -> conn is closed. closing conn explicitly
10:58:32.111944 ▶ NOTI conn localhost:2003 .conn.Read returned EOF -> conn is closed. closing conn explicitly
10:58:33.094729 ▶ NOTI dest localhost:2003 updating conn. online: true
...
Memory profile:
go tool pprof ./carbon-relay-ng http://127.0.0.1:8082/debug/pprof/heap
Wed Sep 20 13:27:27 UTC 2017
Fetching profile over HTTP from http://127.0.0.1:8082/debug/pprof/heap
Saved profile in /home/andrii.radyk/pprof/pprof.carbon-relay-ng.alloc_objects.alloc_space.inuse_objects.inuse_space.077.pb.gz
File: carbon-relay-ng
Type: inuse_space
Time: Sep 20, 2017 at 1:27pm (UTC)
Entering interactive mode (type "help" for commands, "o" for options)
(pprof) top5
Showing nodes accounting for 1.97GB, 99.12% of 1.99GB total
Dropped 300 nodes (cum <= 0.01GB)
Showing top 5 nodes out of 6
flat flat% sum% cum cum%
1.27GB 63.76% 63.76% 1.27GB 63.76% github.com/graphite-ng/carbon-relay-ng/destination.(*keepSafe).keepClean /Users/ander/go/src/github.com/graphite-ng/carbon-relay-ng/destination/keepsafe.go
0.52GB 26.00% 89.76% 0.52GB 26.01% github.com/graphite-ng/carbon-relay-ng/destination.NewWriter /Users/ander/go/src/github.com/graphite-ng/carbon-relay-ng/destination/bufwriter.go
0.19GB 9.35% 99.12% 0.70GB 35.38% github.com/graphite-ng/carbon-relay-ng/destination.NewConn /Users/ander/go/src/github.com/graphite-ng/carbon-relay-ng/destination/conn.go
0 0% 99.12% 0.70GB 35.38% github.com/graphite-ng/carbon-relay-ng/destination.(*Destination).updateConn /Users/ander/go/src/github.com/graphite-ng/carbon-relay-ng/destination/destination.go
0 0% 99.12% 0.01GB 0.54% main.main /Users/ander/go/src/github.com/graphite-ng/carbon-relay-ng/cmd/carbon-relay-ng/carbon-relay-ng.go
(pprof) list keepClean
Total: 1.99GB
ROUTINE ======================== github.com/graphite-ng/carbon-relay-ng/destination.(*keepSafe).keepClean in /Users/ander/go/src/github.com/graphite-ng/carbon-relay-ng/destination/keepsafe.go
1.27GB 1.27GB (flat, cum) 63.76% of Total
. . 23: go k.keepClean()
. . 24: return &k
. . 25:}
. . 26:
. . 27:func (k *keepSafe) keepClean() {
. 52.33kB 28: tick := time.NewTicker(k.periodKeep)
. . 29: for range tick.C {
. . 30: k.Lock()
. . 31: k.safeOld = k.safeRecent
1.27GB 1.27GB 32: k.safeRecent = make([][]byte, 0, k.initialCap)
. . 33: k.Unlock()
. . 34: }
. . 35:}
. . 36:
. . 37:func (k *keepSafe) Add(buf []byte) {
(pprof) list estination.NewWriter
Total: 1.99GB
ROUTINE ======================== github.com/graphite-ng/carbon-relay-ng/destination.NewWriter in /Users/ander/go/src/github.com/graphite-ng/carbon-relay-ng/destination/bufwriter.go
530.22MB 530.31MB (flat, cum) 26.01% of Total
. . 36: if size <= 0 {
. . 37: panic("invalid size requested")
. . 38: }
. . 39: return &Writer{
. . 40: key: key,
530.20MB 530.20MB 41: buf: make([]byte, size),
. . 42: wr: w,
25.97kB 121.36kB 43: durationOverflowFlush: stats.Timer("dest=" + key + ".what=durationFlush.type=overflow"),
. . 44: }
. . 45:}
. . 46:
. . 47:// Flush writes any buffered data to the underlying io.Writer.
. . 48:func (b *Writer) Flush() error {
(pprof) list destination.NewConn
Total: 1.99GB
ROUTINE ======================== github.com/graphite-ng/carbon-relay-ng/destination.NewConn in /Users/ander/go/src/github.com/graphite-ng/carbon-relay-ng/destination/conn.go
190.68MB 721.34MB (flat, cum) 35.38% of Total
. . 50: bufferSize metrics.Gauge
. . 51: numDropBadPickle metrics.Counter
. . 52:}
. . 53:
. . 54:func NewConn(addr string, dest *Destination, periodFlush time.Duration, pickle bool, connBufSize, ioBufSize int) (*Conn, error) {
. 736B 55: raddr, err := net.ResolveTCPAddr("tcp", addr)
. . 56: if err != nil {
. . 57: return nil, err
. . 58: }
. . 59: laddr, _ := net.ResolveTCPAddr("tcp", "0.0.0.0")
. 80.81kB 60: conn, err := net.DialTCP("tcp", laddr, raddr)
. . 61: if err != nil {
. . 62: return nil, err
. . 63: }
. 5.42kB 64: cleanAddr := util.AddrToPath(addr)
. . 65: connObj := &Conn{
. . 66: conn: conn,
. 530.31MB 67: buffered: NewWriter(conn, ioBufSize, cleanAddr),
30.30kB 30.30kB 68: shutdown: make(chan bool, 1), // when we write here, HandleData() may not be running anymore to read from the chan
190.46MB 190.46MB 69: In: make(chan []byte, connBufSize),
. . 70: dest: dest,
. . 71: up: true,
. . 72: pickle: pickle,
25.97kB 25.97kB 73: checkUp: make(chan bool),
25.97kB 25.97kB 74: updateUp: make(chan bool),
25.97kB 25.97kB 75: flush: make(chan bool),
25.97kB 25.97kB 76: flushErr: make(chan error),
. . 77: periodFlush: periodFlush,
. 21.65kB 78: keepSafe: NewKeepSafe(keepsafe_initial_cap, keepsafe_keep_duration),
. 296B 79: numErrTruncated: stats.Counter("dest=" + cleanAddr + ".unit=Err.type=truncated"),
. 244B 80: numErrWrite: stats.Counter("dest=" + cleanAddr + ".unit=Err.type=write"),
. 244B 81: numErrFlush: stats.Counter("dest=" + cleanAddr + ".unit=Err.type=flush"),
. 276B 82: numOut: stats.Counter("dest=" + cleanAddr + ".unit=Metric.direction=out"),
. 83.39kB 83: durationWrite: stats.Timer("dest=" + cleanAddr + ".what=durationWrite"),
. 83.14kB 84: durationTickFlush: stats.Timer("dest=" + cleanAddr + ".what=durationFlush.type=ticker"),
. 83.14kB 85: durationManuFlush: stats.Timer("dest=" + cleanAddr + ".what=durationFlush.type=manual"),
. 362B 86: tickFlushSize: stats.Histogram("dest=" + cleanAddr + ".unit=B.what=FlushSize.type=ticker"),
. 362B 87: manuFlushSize: stats.Histogram("dest=" + cleanAddr + ".unit=B.what=FlushSize.type=manual"),
. 276B 88: numBuffered: stats.Gauge("dest=" + cleanAddr + ".unit=Metric.what=numBuffered"),
. 276B 89: bufferSize: stats.Gauge("dest=" + cleanAddr + ".unit=Metric.what=bufferSize"),
86.56kB 86.86kB 90: numDropBadPickle: stats.Counter("dest=" + cleanAddr + ".unit=Metric.action=drop.reason=bad_pickle"),
. . 91: }
. . 92: connObj.bufferSize.Update(int64(connBufSize))
. . 93:
. . 94: go connObj.checkEOF()
. . 95:
(pprof)
@Dieterbe, any news about this issue?
you're sure the rate is only 500 metrics/s across all routes? if so, this looks like somehow references to old connections stick around and aren't cleaned up properly, i have no other explanation for why those structures would accumulate so much space otherwise. this needs more investigation but i don't have time right now.
Unfortunately I can confirm this issue - I see them on very busy and even on rather bored realys.
% go tool pprof ./carbon-relay-ng http://127.0.0.1:4080/debug/pprof/heap
Fetching profile over HTTP from http://127.0.0.1:4080/debug/pprof/heap
Saved profile in /home/bzed/pprof/pprof.carbon-relay-ng.alloc_objects.alloc_space.inuse_objects.inuse_space.001.pb.gz
File: carbon-relay-ng
Type: inuse_space
Time: Dec 18, 2017 at 2:09pm (CET)
Entering interactive mode (type "help" for commands, "o" for options)
(pprof) top
Showing nodes accounting for 33.28GB, 99.74% of 33.37GB total
Dropped 50 nodes (cum <= 0.17GB)
flat flat% sum% cum cum%
14.90GB 44.67% 44.67% 14.91GB 44.67% github.com/graphite-ng/carbon-relay-ng/destination.NewWriter /home/bzed/workspace/gocode/src/github.com/graphite-ng/carbon-relay-ng/destination/bufwriter.go
10.73GB 32.17% 76.84% 25.64GB 76.84% github.com/graphite-ng/carbon-relay-ng/destination.NewConn /home/bzed/workspace/gocode/src/github.com/graphite-ng/carbon-relay-ng/destination/conn.go
7.64GB 22.91% 99.74% 7.64GB 22.91% github.com/graphite-ng/carbon-relay-ng/destination.(*keepSafe).keepClean /home/bzed/workspace/gocode/src/github.com/graphite-ng/carbon-relay-ng/destination/keepsafe.go
0 0% 99.74% 25.64GB 76.84% github.com/graphite-ng/carbon-relay-ng/destination.(*Destination).updateConn /home/bzed/workspace/gocode/src/github.com/graphite-ng/carbon-relay-ng/destination/destination.go
(pprof) list destination.NewWriter
Total: 33.37GB
ROUTINE ======================== github.com/graphite-ng/carbon-relay-ng/destination.NewWriter in /home/bzed/workspace/gocode/src/github.com/graphite-ng/carbon-relay-ng/destination/bufwriter.go
14.90GB 14.91GB (flat, cum) 44.67% of Total
. . 36: if size <= 0 {
. . 37: panic("invalid size requested")
. . 38: }
. . 39: return &Writer{
. . 40: key: key,
14.90GB 14.90GB 41: buf: make([]byte, size),
. . 42: wr: w,
. 512.02kB 43: durationOverflowFlush: stats.Timer("dest=" + key + ".what=durationFlush.type=overflow"),
. . 44: }
. . 45:}
. . 46:
. . 47:// Flush writes any buffered data to the underlying io.Writer.
. . 48:func (b *Writer) Flush() error {
(pprof) list destination.NewConn
Total: 33.37GB
ROUTINE ======================== github.com/graphite-ng/carbon-relay-ng/destination.NewConn in /home/bzed/workspace/gocode/src/github.com/graphite-ng/carbon-relay-ng/destination/conn.go
10.73GB 25.64GB (flat, cum) 76.84% of Total
. . 55: raddr, err := net.ResolveTCPAddr("tcp", addr)
. . 56: if err != nil {
. . 57: return nil, err
. . 58: }
. . 59: laddr, _ := net.ResolveTCPAddr("tcp", "0.0.0.0")
. 512.02kB 60: conn, err := net.DialTCP("tcp", laddr, raddr)
. . 61: if err != nil {
. . 62: return nil, err
. . 63: }
. . 64: cleanAddr := util.AddrToPath(addr)
. . 65: connObj := &Conn{
. . 66: conn: conn,
. 14.91GB 67: buffered: NewWriter(conn, ioBufSize, cleanAddr),
. . 68: shutdown: make(chan bool, 1), // when we write here, HandleData() may not be running anymore to read from the chan
10.73GB 10.73GB 69: In: make(chan []byte, connBufSize),
. . 70: dest: dest,
. . 71: up: true,
. . 72: pickle: pickle,
. . 73: checkUp: make(chan bool),
. . 74: updateUp: make(chan bool),
512.05kB 512.05kB 75: flush: make(chan bool),
. . 76: flushErr: make(chan error),
. . 77: periodFlush: periodFlush,
. 512.04kB 78: keepSafe: NewKeepSafe(keepsafe_initial_cap, keepsafe_keep_duration),
. . 79: numErrTruncated: stats.Counter("dest=" + cleanAddr + ".unit=Err.type=truncated"),
. . 80: numErrWrite: stats.Counter("dest=" + cleanAddr + ".unit=Err.type=write"),
. . 81: numErrFlush: stats.Counter("dest=" + cleanAddr + ".unit=Err.type=flush"),
. . 82: numOut: stats.Counter("dest=" + cleanAddr + ".unit=Metric.direction=out"),
. 512.05kB 83: durationWrite: stats.Timer("dest=" + cleanAddr + ".what=durationWrite"),
. 512.02kB 84: durationTickFlush: stats.Timer("dest=" + cleanAddr + ".what=durationFlush.type=ticker"),
. . 85: durationManuFlush: stats.Timer("dest=" + cleanAddr + ".what=durationFlush.type=manual"),
. . 86: tickFlushSize: stats.Histogram("dest=" + cleanAddr + ".unit=B.what=FlushSize.type=ticker"),
. . 87: manuFlushSize: stats.Histogram("dest=" + cleanAddr + ".unit=B.what=FlushSize.type=manual"),
. . 88: numBuffered: stats.Gauge("dest=" + cleanAddr + ".unit=Metric.what=numBuffered"),
. . 89: bufferSize: stats.Gauge("dest=" + cleanAddr + ".unit=Metric.what=bufferSize"),
2MB 2MB 90: numDropBadPickle: stats.Counter("dest=" + cleanAddr + ".unit=Metric.action=drop.reason=bad_pickle"),
. . 91: }
. . 92: connObj.bufferSize.Update(int64(connBufSize))
. . 93:
. . 94: go connObj.checkEOF()
. . 95:
(pprof) list keepSafe
Total: 33.37GB
ROUTINE ======================== github.com/graphite-ng/carbon-relay-ng/destination.(*keepSafe).keepClean in /home/bzed/workspace/gocode/src/github.com/graphite-ng/carbon-relay-ng/destination/keepsafe.go
7.64GB 7.64GB (flat, cum) 22.91% of Total
. . 27:func (k *keepSafe) keepClean() {
. . 28: tick := time.NewTicker(k.periodKeep)
. . 29: for range tick.C {
. . 30: k.Lock()
. . 31: k.safeOld = k.safeRecent
7.64GB 7.64GB 32: k.safeRecent = make([][]byte, 0, k.initialCap)
. . 33: k.Unlock()
. . 34: }
. . 35:}
. . 36:
. . 37:func (k *keepSafe) Add(buf []byte) {
(pprof)
I think the commit mentioned above makes things better - need to run it for some hours to have some comparable results. Seems there is still a memory leak somewhere, though. Reproducing the problem is easy: use haproxy or nc to listen on a lot of ports, connect carbon-relay-ng to them and restart your listener several times (in case of haproxy: stop and start, restarts will pass on connections).
Looking at http://shell.bzed.at/~bzed/.publish/2017-12-20-x32bC9H8WkI/Screenshot_20171220_101120.png the real reason doesn't seem to be fixed - as it still leaks some memory, but my workaround works.
Still leaking in
ROUTINE ======================== github.com/graphite-ng/carbon-relay-ng/destination.(*keepSafe).keepClean in /home/bzed/workspace/gocode/src/github.com/graphite-ng/carbon-relay-ng/destination/keepsafe.go
1.99GB 1.99GB (flat, cum) 88.43% of Total
. . 27:func (k *keepSafe) keepClean() {
. . 28: tick := time.NewTicker(k.periodKeep)
. . 29: for range tick.C {
. . 30: k.Lock()
. . 31: k.safeOld = k.safeRecent
1.99GB 1.99GB 32: k.safeRecent = make([][]byte, 0, k.initialCap)
. . 33: k.Unlock()
. . 34: }
. . 35:}
. . 36:
. . 37:func (k *keepSafe) Add(buf []byte) {
@bzed,
https://github.com/graphite-ng/carbon-relay-ng/issues/221 is tested on real production traffic. Confirmed that memory leaks are gone and the RES memory is stable around 407MB.
the problem with the keepsafe stuff is: 1) the keepClean goroutine leaks (remains alive after the keepsafe is no longer used) 2) because of 1, the k.safeOld and k.safeRecent are maintained (and always contain k.initialCap worth of data)
I don't think the PR properly addresses these issues. i'm working one which I think does : https://github.com/graphite-ng/carbon-relay-ng/pull/259
i'll have a look at the writer stuff next
followup on above message. I have been looking at the writer stuff but it looks sane. I see no reason why the bufwriter memory would remain live when it shouldn't. i also tried with this patch and a test setup where i continuously kill and re-instantiate an endpoint and the logs say:
DIETER NUMCONNS 1
DIETER NUMCONNS 0
DIETER NUMCONNS 1
DIETER NUMCONNS 0
DIETER NUMCONNS 1
DIETER NUMCONNS 0
IOW I think the conn objects are correctly cleaned up, the writers showing up in the mem profiles looks legitimate. @bzed @AnderEnder instead of #248 could you try #259 and post your findings?
for a sanity check, it would also help if you can enable debug mode and confirm that each log entry like
.conn.Read returned EOF -> conn is closed. closing conn explicitly", c.dest.Addr)
is followed by these shortly after.
log.Debug("conn %s Close() called. sending shutdown\n", c.dest.Addr)
log.Debug("conn %s c.conn.Close()\n", c.dest.Addr)
log.Debug("conn %s c.conn is closed\n", c.dest.Addr)
anyone ? @bzed @AnderEnder see my 2 comments above please. I'ld like to get the proper fix merged.
@Dieterbe, unfortunately I do not have the environment anymore, where I can reproduce it. I can try to reproduce it locally and get back to you.
that would be appreciated, thanks.
@Dieterbe sorry, was on holidays and still trying to catch up with todos.... its on the list!
@Dieterbe,
Unfortunately my test shows that the issue is till there:
vagrant@carbon-dev:/home/go/src/github.com/graphite-ng/carbon-relay-ng$ ./carbon-relay-ng version
carbon-relay-ng 0.9.4-8-g0d50fe3 (built with go1.10)
vagrant@carbon-dev:/home/go/src/github.com/graphite-ng/carbon-relay-ng$ while true; do ps auxwww | grep carbon-relay-ng | grep -v grep ; sleep 60; done
vagrant 2347 10.2 1.8 178984 38180 pts/0 Sl 16:01 0:01 /home/go/src/github.com/graphite-ng/carbon-relay-ng/carbon-relay-ng /home/carbon/carbon-relay-ng.ini
vagrant 2347 16.0 6.1 271860 124980 pts/0 Sl 16:01 0:11 /home/go/src/github.com/graphite-ng/carbon-relay-ng/carbon-relay-ng /home/carbon/carbon-relay-ng.ini
vagrant 2347 14.4 13.0 281640 267056 pts/0 Sl 16:01 0:19 /home/go/src/github.com/graphite-ng/carbon-relay-ng/carbon-relay-ng /home/carbon/carbon-relay-ng.ini
vagrant 2347 15.2 22.2 472300 456372 pts/0 Sl 16:01 0:29 /home/go/src/github.com/graphite-ng/carbon-relay-ng/carbon-relay-ng /home/carbon/carbon-relay-ng.ini
vagrant 2347 14.9 24.0 506516 492788 pts/0 Sl 16:01 0:37 /home/go/src/github.com/graphite-ng/carbon-relay-ng/carbon-relay-ng /home/carbon/carbon-relay-ng.ini
vagrant 2347 14.6 24.1 565180 495064 pts/0 Sl 16:01 0:45 /home/go/src/github.com/graphite-ng/carbon-relay-ng/carbon-relay-ng /home/carbon/carbon-relay-ng.ini
vagrant 2347 14.0 27.7 635340 567740 pts/0 Sl 16:01 0:52 /home/go/src/github.com/graphite-ng/carbon-relay-ng/carbon-relay-ng /home/carbon/carbon-relay-ng.ini
vagrant 2347 13.9 31.1 669560 638840 pts/0 Sl 16:01 1:00 /home/go/src/github.com/graphite-ng/carbon-relay-ng/carbon-relay-ng /home/carbon/carbon-relay-ng.ini
vagrant 2347 13.8 37.6 925352 770616 pts/0 Sl 16:01 1:08 /home/go/src/github.com/graphite-ng/carbon-relay-ng/carbon-relay-ng /home/carbon/carbon-relay-ng.ini
vagrant 2347 13.8 38.0 925416 779568 pts/0 Sl 16:01 1:16 /home/go/src/github.com/graphite-ng/carbon-relay-ng/carbon-relay-ng /home/carbon/carbon-relay-ng.ini
vagrant 2347 13.7 39.3 965188 804880 pts/0 Sl 16:01 1:24 /home/go/src/github.com/graphite-ng/carbon-relay-ng/carbon-relay-ng /home/carbon/carbon-relay-ng.ini
vagrant 2347 14.1 42.6 965252 872464 pts/0 Sl 16:01 1:35 /home/go/src/github.com/graphite-ng/carbon-relay-ng/carbon-relay-ng /home/carbon/carbon-relay-ng.ini
vagrant 2347 14.5 43.1 1063028 883828 pts/0 Rl 16:01 1:46 /home/go/src/github.com/graphite-ng/carbon-relay-ng/carbon-relay-ng /home/carbon/carbon-relay-ng.ini
vagrant 2347 14.9 44.5 1063028 913020 pts/0 Sl 16:01 1:58 /home/go/src/github.com/graphite-ng/carbon-relay-ng/carbon-relay-ng /home/carbon/carbon-relay-ng.ini
vagrant 2347 15.0 45.3 1175460 928912 pts/0 Sl 16:01 2:08 /home/go/src/github.com/graphite-ng/carbon-relay-ng/carbon-relay-ng /home/carbon/carbon-relay-ng.ini
vagrant 2347 16.1 47.4 1175460 971384 pts/0 Sl 16:01 2:27 /home/go/src/github.com/graphite-ng/carbon-relay-ng/carbon-relay-ng /home/carbon/carbon-relay-ng.ini
vagrant 2347 16.9 47.6 1295228 975180 pts/0 Sl 16:01 2:44 /home/go/src/github.com/graphite-ng/carbon-relay-ng/carbon-relay-ng /home/carbon/carbon-relay-ng.ini
vagrant 2347 17.7 51.3 1295228 1050956 pts/0 Sl 16:01 3:03 /home/go/src/github.com/graphite-ng/carbon-relay-ng/carbon-relay-ng /home/carbon/carbon-relay-ng.ini
vagrant 2347 19.1 51.1 1402780 1046724 pts/0 Sl 16:01 3:29 /home/go/src/github.com/graphite-ng/carbon-relay-ng/carbon-relay-ng /home/carbon/carbon-relay-ng.ini
vagrant 2347 21.1 53.7 1402780 1099796 pts/0 Sl 16:01 4:03 /home/go/src/github.com/graphite-ng/carbon-relay-ng/carbon-relay-ng /home/carbon/carbon-relay-ng.ini
vagrant 2347 21.8 53.6 1510328 1098864 pts/0 Sl 16:01 4:25 /home/go/src/github.com/graphite-ng/carbon-relay-ng/carbon-relay-ng /home/carbon/carbon-relay-ng.ini
vagrant 2347 22.3 56.7 1510328 1161968 pts/0 Sl 16:01 4:44 /home/go/src/github.com/graphite-ng/carbon-relay-ng/carbon-relay-ng /home/carbon/carbon-relay-ng.ini
vagrant 2347 23.4 56.8 1608100 1164788 pts/0 Sl 16:01 5:12 /home/go/src/github.com/graphite-ng/carbon-relay-ng/carbon-relay-ng /home/carbon/carbon-relay-ng.ini
vagrant 2347 24.9 59.4 1608100 1217216 pts/0 Sl 16:01 5:47 /home/go/src/github.com/graphite-ng/carbon-relay-ng/carbon-relay-ng /home/carbon/carbon-relay-ng.ini
vagrant 2347 25.7 60.3 1725428 1235188 pts/0 Rl 16:01 6:14 /home/go/src/github.com/graphite-ng/carbon-relay-ng/carbon-relay-ng /home/carbon/carbon-relay-ng.ini
vagrant 2347 26.9 64.0 1725428 1311740 pts/0 Sl 16:01 6:47 /home/go/src/github.com/graphite-ng/carbon-relay-ng/carbon-relay-ng /home/carbon/carbon-relay-ng.ini
vagrant 2347 27.8 64.2 1832980 1315732 pts/0 Sl 16:01 7:19 /home/go/src/github.com/graphite-ng/carbon-relay-ng/carbon-relay-ng /home/carbon/carbon-relay-ng.ini
vagrant 2347 29.0 67.6 1832980 1384340 pts/0 Sl 16:01 7:55 /home/go/src/github.com/graphite-ng/carbon-relay-ng/carbon-relay-ng /home/carbon/carbon-relay-ng.ini
vagrant 2347 29.9 67.7 1942980 1388124 pts/0 Sl 16:01 8:28 /home/go/src/github.com/graphite-ng/carbon-relay-ng/carbon-relay-ng /home/carbon/carbon-relay-ng.ini
vagrant 2347 30.8 71.7 1942980 1468740 pts/0 Sl 16:01 9:01 /home/go/src/github.com/graphite-ng/carbon-relay-ng/carbon-relay-ng /home/carbon/carbon-relay-ng.ini
vagrant 2347 31.8 71.8 2048080 1470916 pts/0 Sl 16:01 9:37 /home/go/src/github.com/graphite-ng/carbon-relay-ng/carbon-relay-ng /home/carbon/carbon-relay-ng.ini
So 30 minutes and 1.5Gb is already consumed by carbon-relay-ng.
I used the same version go-carbon: 0.10.1, which closes incoming connections very often. It does not require any traffic at all.
you sure you ran the code from #259 right? is there an easy way to replicate your setup? if so can you provide instructions and configs.
@Dieterbe the code from #259 is running well for some days now. Looking at kcachegrind I think I see some minor memory leaks that were gone with my changes, but so far I can't complain.
you sure you ran the code from #259 right? is there an easy way to replicate your setup? if so can you provide instructions and configs.
@Dieterbe, I described the version in the previous message: 0.9.4-8-g0d50fe3, so the revision is 0d50fe3:
$ git checkout 0d50fe3
HEAD is now at 0d50fe3 fix goroutine and memory leak in keepSafe
$ git log -n1
commit 0d50fe3725514c3a4233b492afa25002623fd6ed (HEAD -> memleak-fix2, origin/memleak-fix2, origin/memleak-fix)
Author: Dieter Plaetinck <dieter@grafana.com>
Date: Wed Feb 21 15:52:45 2018 +0100
fix goroutine and memory leak in keepSafe
...
Do you need a profiling for this version? I assume that it will be similar to the previous one.
OK i missed that, that's the right version hmm that's strange then. for @bzed #259 seems to work fine, but for you it doesn't. can you provide steps to reproduce?
Good news. I finally had some time to dig into this. Using @AnderEnder 's instructions above I was able to consistently reproduce and experiment. For my experiments i patched go-carbon to timeout the inbound connection after 10s. This made the issue very visible. And it shows how bad it was.
I've found several issues and fixed them. My inital PR, #259 was a partial fix and I have merged it to master. Followup fixes are in PR #329
I used this script to collect profiles, memory measurements, and output, stepping through the various commits, before the merge of #259, after the merge of #259, and then all commits in the new PR, and it plots the memory stats via gnuplot.
48ba6d0c366928f6e7d89164cf57f67c7501c48d
Pretty clearly, terribly leaky.
13677e76494dde60002cd6b52a496780ec96f3ee Better, but still leaky.
The rss measurements seem to be randomly transposed over the time axis. not sure why. seems like the golang heap measurement is more reliable and useful.
09256f8540d956effaa7f40a19bd4d50abe711fd 179dca380fb2c347d0ecc9b84f9f055ffc248fca 51decb33ce21c83d2db9ba24b3f4543079db5f45
this was preventing Conn from getting GC'd. This was basically the main fix right here. 675dad74d926c7655643b74b4b9b02fb3cfb3c21
3e1dcd45c84d34277994ffa4af0f9b0d530266ed 9c84297b85763bc1887aa2da8b6ec55d6f4aa368 890aac2fd9cea23838c5ea6ca993158fdb78d522
code cleanup + fix when keepSafe is closed not much difference visible here. the heap differences in spikes are probably simply measurement artifacts. there was a bug in #259, which is we shouldn't close keepSafe when marking the connection as dead, but only after giving the destination the change to read the keepSafe buffer. so we fix that here, it's a slight timing change.
I believe this is finally fixed now. Please test #329; i want to merge it soon.
I have merged the PR to master. so you can test it. note that the latest but unreleased code now uses the master tag on docker hub, and a separate repository. see #330 for more info.
It's running fine in our dev environment since yesterday. Will start to put it on prod next week, so far no issues.
As I'm feeling pretty confident about this, and a bunch of other stuff was dying to make it into a release, I've gone ahead and tagged the new release 0.11.0, so now you can deploy that. I'm gonna close this issue but feel free to post further updates and experiences here.
We use the following toolset : carbon-relay-ng + go-carbon. Load is not big: ~500 metrics per second.
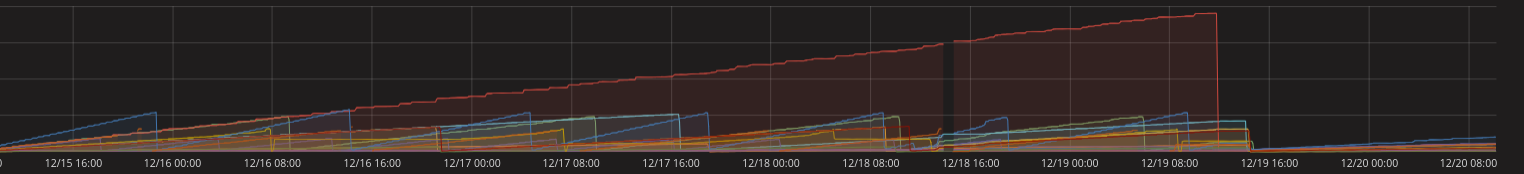
Issue: The memory grows until OOM killer kills the process (up to several GB).
There are 14 routes in configuration similar to:
Notice logs show that some connections are closed and reopened:
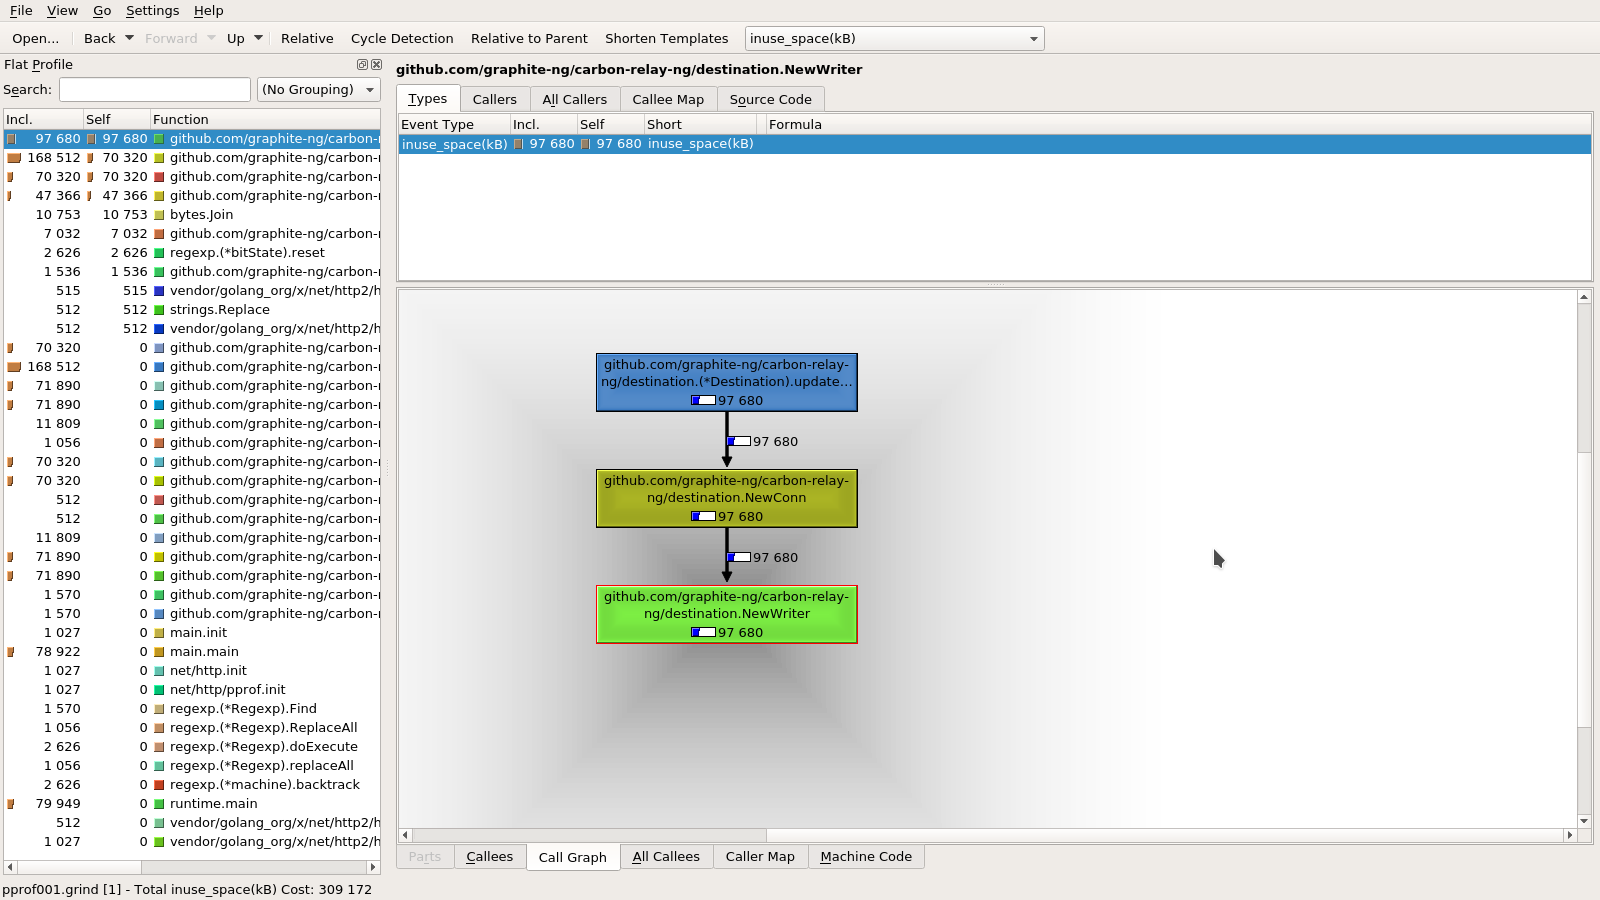
Profiling example shows:
The memory are used by keepSafe and Writer buffers. Looks like a number of conn objects are growing over the time, but old ones are not destroyed.