grafana / grafana

The open and composable observability and data visualization platform. Visualize metrics, logs, and traces from multiple sources like Prometheus, Loki, Elasticsearch, InfluxDB, Postgres and many more.
https://grafana.com
GNU Affero General Public License v3.0
60.72k stars 11.61k forks source link

Transformation: Grouping to matrix header incorrect #87332

Open danialre opened 2 weeks ago

danialre commented 2 weeks ago

What happened?

When using the "Grouping to matrix" transformation on table data, the name of the Cell value field appears in the header instead of the value referred by the Column name. Screenshot 2024-05-03 at 9 09 04 AM Screenshot 2024-05-03 at 9 08 55 AM

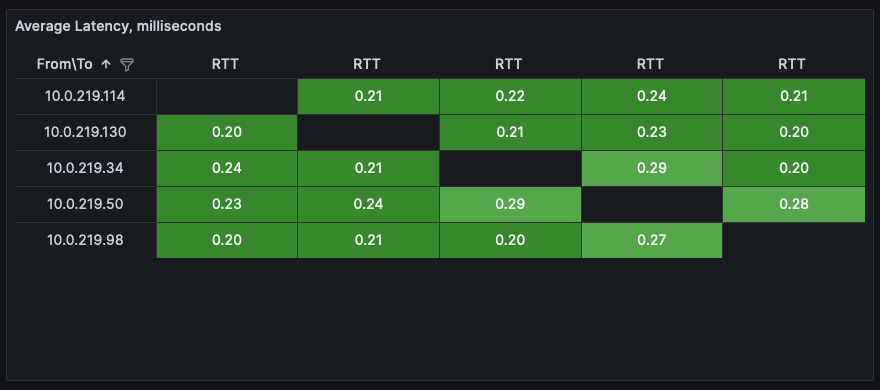
Editing the transformation by removing/re-adding the Column field fixes the headers until the next dashboard refresh or page reload.

What did you expect to happen?

The value in the column field of the transformation should show up in the header of the table. Screenshot 2024-05-03 at 8 53 56 AM

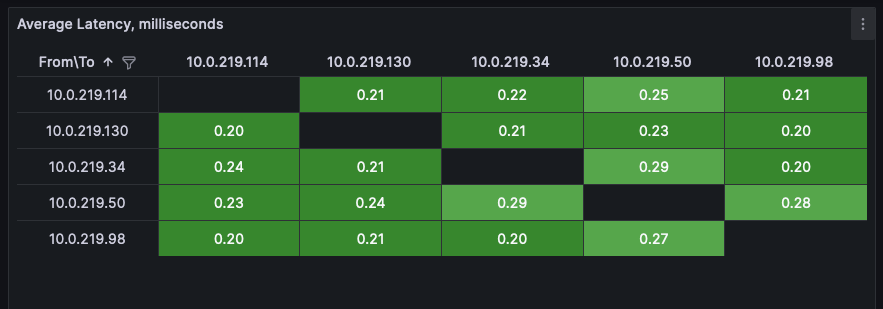
Did this work before?

Yes, up to and including 10.2.2

How do we reproduce it?

  1. Use Grafana 10.2.3 or newer
  2. Use an Influx datasource, with a measurement that has at least two tags
  3. In a table panel, set up the data source to group by those two tags, remove the default time group by, and format as table (optional - add an alias to the field)
  4. Add a Grouping to matrix transformation with one tag as row, other tag as column, and the field/alias name as the Cell value
  5. Apply table, then refresh dashboard data or reload the page

Is the bug inside a dashboard panel?

Key Value
Panel table @ 10.2.3
Grafana 10.2.3 (1e84fede543acc892d2a2515187e545eb047f237) // Open Source
Panel debug snapshot dashboard ```json { "panels": [ { "datasource": { "type": "grafana", "uid": "grafana" }, "description": "", "fieldConfig": { "defaults": { "custom": { "align": "center", "cellOptions": { "type": "auto" }, "inspect": false, "minWidth": 50 }, "mappings": [], "thresholds": { "mode": "absolute", "steps": [ { "color": "transparent", "value": null }, { "color": "dark-green", "value": 0.1 }, { "color": "semi-dark-green", "value": 0.25 }, { "color": "green", "value": 0.5 }, { "color": "#EAB839", "value": 2 }, { "color": "red", "value": 10 } ] }, "color": { "mode": "thresholds" }, "decimals": 2, "max": 10, "min": 0, "unit": "short" }, "overrides": [ { "matcher": { "id": "byType", "options": "number" }, "properties": [ { "id": "custom.cellOptions", "value": { "mode": "basic", "type": "color-background" } } ] }, { "matcher": { "id": "byName", "options": "From\\To" }, "properties": [ { "id": "custom.filterable", "value": true }, { "id": "mappings", "value": [ { "options": { "pattern": "192.168.(.*)", "result": { "index": 0, "text": "10.0.$1" } }, "type": "regex" } ] } ] } ] }, "gridPos": { "h": 13, "w": 15, "x": 0, "y": 0 }, "id": 2, "interval": "1m", "options": { "showHeader": true, "cellHeight": "sm", "footer": { "show": false, "reducer": [ "sum" ], "countRows": false, "fields": "" }, "sortBy": [ { "desc": false, "displayName": "From\\To" } ] }, "pluginVersion": "10.2.3", "targets": [ { "refId": "A", "datasource": { "type": "grafana", "uid": "grafana" }, "queryType": "snapshot", "snapshot": [ { "schema": { "refId": "A", "meta": { "typeVersion": [ 0, 0 ], "preferredVisualisationType": "table", "executedQueryString": "SELECT mean(\"mean\") *1000 AS \"RTT\" FROM \"rtt\" WHERE time >= 1714749261712ms and time <= 1714750161712ms GROUP BY \"test_spec_source\", \"test_spec_dest\"::tag ORDER BY time ASC", "transformations": [ "organize", "organize", "organize", "organize", "organize", "organize", "organize", "organize", "organize", "organize", "organize", "organize", "organize", "organize", "organize", "organize", "organize", "organize" ] }, "name": "rtt", "fields": [ { "name": "Time", "type": "time", "typeInfo": { "frame": "time.Time" }, "config": {} }, { "name": "test_spec_dest", "type": "string", "typeInfo": { "frame": "string", "nullable": true }, "config": { "displayNameFromDS": "test_spec_dest" } }, { "name": "test_spec_source", "type": "string", "typeInfo": { "frame": "string", "nullable": true }, "config": { "displayNameFromDS": "test_spec_source" } }, { "name": "RTT", "type": "number", "typeInfo": { "frame": "float64", "nullable": true }, "config": { "displayNameFromDS": "RTT" } } ] }, "data": { "values": [ [ 1714749261712, 1714749261712, 1714749261712, 1714749261712, 1714749261712, 1714749261712, 1714749261712, 1714749261712, 1714749261712, 1714749261712, 1714749261712, 1714749261712, 1714749261712, 1714749261712, 1714749261712 ], [ "192.168.219.114", "192.168.219.114", "192.168.219.114", "192.168.219.130", "192.168.219.130", "192.168.219.130", "192.168.219.34", "192.168.219.34", "192.168.219.34", "192.168.219.50", "192.168.219.50", "192.168.219.50", "192.168.219.98", "192.168.219.98", "192.168.219.98" ], [ "192.168.219.130", "192.168.219.50", "192.168.219.98", "192.168.219.114", "192.168.219.50", "192.168.219.98", "192.168.219.130", "192.168.219.50", "192.168.219.98", "192.168.219.114", "192.168.219.130", "192.168.219.98", "192.168.219.114", "192.168.219.130", "192.168.219.50" ], [ 0.208, 0.236, 0.222, 0.2, 0.23299999999999998, 0.19699999999999998, 0.19699999999999998, 0.2955, 0.17, 0.23900000000000002, 0.219, 0.27599999999999997, 0.21000000000000002, 0.194, 0.28150000000000003 ] ] } } ] } ], "title": "Reproduced with embedded data", "transformations": [ { "id": "organize", "options": { "excludeByName": {}, "includeByName": {}, "indexByName": {}, "renameByName": { "test_spec_dest": "To", "test_spec_source": "From" } } }, { "id": "groupingToMatrix", "options": { "columnField": "To", "rowField": "From", "valueField": "RTT" } }, { "id": "renameByRegex", "options": { "regex": "192.168.(.*)", "renamePattern": "10.0.$1" } } ], "type": "table" }, { "gridPos": { "h": 7, "w": 9, "x": 15, "y": 0 }, "id": 5, "options": { "content": "\n \n \n \n \n \n \n \n \n \n \n \n \n \n \n \n \n \n \n
Paneltable @ 10.2.3
QueriesA[influxdb]
Transformorganize, groupingToMatrix, renameByRegex
Data 1 frames, 4 fields, 15 rows
Grafana10.2.3 (1e84fede543acc892d2a2515187e545eb047f237) // Open Source
", "mode": "html" }, "title": "Debug info", "type": "text" }, { "id": 6, "title": "Original Panel JSON", "type": "text", "gridPos": { "h": 13, "w": 9, "x": 15, "y": 7 }, "options": { "content": "{\n \"datasource\": {\n \"type\": \"influxdb\",\n \"uid\": \"ece7517f-dba7-4fba-ab26-6920b4c7a352\"\n },\n \"description\": \"\",\n \"fieldConfig\": {\n \"defaults\": {\n \"custom\": {\n \"align\": \"center\",\n \"cellOptions\": {\n \"type\": \"auto\"\n },\n \"inspect\": false,\n \"minWidth\": 50\n },\n \"mappings\": [],\n \"thresholds\": {\n \"mode\": \"absolute\",\n \"steps\": [\n {\n \"color\": \"transparent\",\n \"value\": null\n },\n {\n \"color\": \"dark-green\",\n \"value\": 0.1\n },\n {\n \"color\": \"semi-dark-green\",\n \"value\": 0.25\n },\n {\n \"color\": \"green\",\n \"value\": 0.5\n },\n {\n \"color\": \"#EAB839\",\n \"value\": 2\n },\n {\n \"color\": \"red\",\n \"value\": 10\n }\n ]\n },\n \"color\": {\n \"mode\": \"thresholds\"\n },\n \"decimals\": 2,\n \"max\": 10,\n \"min\": 0,\n \"unit\": \"short\"\n },\n \"overrides\": [\n {\n \"matcher\": {\n \"id\": \"byType\",\n \"options\": \"number\"\n },\n \"properties\": [\n {\n \"id\": \"custom.cellOptions\",\n \"value\": {\n \"mode\": \"basic\",\n \"type\": \"color-background\"\n }\n }\n ]\n },\n {\n \"matcher\": {\n \"id\": \"byName\",\n \"options\": \"From\\\\To\"\n },\n \"properties\": [\n {\n \"id\": \"custom.filterable\",\n \"value\": true\n },\n {\n \"id\": \"mappings\",\n \"value\": [\n {\n \"options\": {\n \"pattern\": \"192.168.(.*)\",\n \"result\": {\n \"index\": 0,\n \"text\": \"10.0.$1\"\n }\n },\n \"type\": \"regex\"\n }\n ]\n }\n ]\n }\n ]\n },\n \"gridPos\": {\n \"h\": 10,\n \"w\": 12,\n \"x\": 0,\n \"y\": 0\n },\n \"id\": 1,\n \"interval\": \"1m\",\n \"options\": {\n \"showHeader\": true,\n \"cellHeight\": \"sm\",\n \"footer\": {\n \"show\": false,\n \"reducer\": [\n \"sum\"\n ],\n \"countRows\": false,\n \"fields\": \"\"\n },\n \"sortBy\": [\n {\n \"desc\": false,\n \"displayName\": \"From\\\\To\"\n }\n ]\n },\n \"pluginVersion\": \"10.2.3\",\n \"targets\": [\n {\n \"datasource\": {\n \"type\": \"influxdb\",\n \"uid\": \"ece7517f-dba7-4fba-ab26-6920b4c7a352\"\n },\n \"groupBy\": [\n {\n \"params\": [\n \"test_spec_source\"\n ],\n \"type\": \"tag\"\n },\n {\n \"params\": [\n \"test_spec_dest::tag\"\n ],\n \"type\": \"tag\"\n }\n ],\n \"measurement\": \"rtt\",\n \"orderByTime\": \"ASC\",\n \"policy\": \"default\",\n \"refId\": \"A\",\n \"resultFormat\": \"table\",\n \"select\": [\n [\n {\n \"params\": [\n \"mean\"\n ],\n \"type\": \"field\"\n },\n {\n \"params\": [],\n \"type\": \"mean\"\n },\n {\n \"params\": [\n \"*1000\"\n ],\n \"type\": \"math\"\n },\n {\n \"params\": [\n \"RTT\"\n ],\n \"type\": \"alias\"\n }\n ]\n ],\n \"tags\": []\n }\n ],\n \"title\": \"Average Latency, milliseconds\",\n \"transformations\": [\n {\n \"id\": \"organize\",\n \"options\": {\n \"excludeByName\": {},\n \"includeByName\": {},\n \"indexByName\": {},\n \"renameByName\": {\n \"test_spec_dest\": \"To\",\n \"test_spec_source\": \"From\"\n }\n }\n },\n {\n \"id\": \"groupingToMatrix\",\n \"options\": {\n \"columnField\": \"To\",\n \"rowField\": \"From\",\n \"valueField\": \"RTT\"\n }\n },\n {\n \"id\": \"renameByRegex\",\n \"options\": {\n \"regex\": \"192.168.(.*)\",\n \"renamePattern\": \"10.0.$1\"\n }\n }\n ],\n \"type\": \"table\"\n}", "mode": "code", "code": { "language": "json", "showLineNumbers": true, "showMiniMap": true } } }, { "id": 3, "title": "Data from panel above (after transformations)", "type": "table", "datasource": { "type": "datasource", "uid": "-- Dashboard --" }, "gridPos": { "h": 7, "w": 15, "x": 0, "y": 13 }, "options": { "showTypeIcons": true }, "targets": [ { "datasource": { "type": "datasource", "uid": "-- Dashboard --" }, "panelId": 2, "withTransforms": true, "refId": "A" } ] }, { "id": 100, "title": "Data (before transformations)", "type": "table", "datasource": { "type": "datasource", "uid": "-- Dashboard --" }, "gridPos": { "h": 7, "w": 24, "x": 0, "y": 13 }, "options": { "showTypeIcons": true }, "targets": [ { "datasource": { "type": "datasource", "uid": "-- Dashboard --" }, "panelId": 2, "withTransforms": false, "refId": "A" } ] } ], "schemaVersion": 37, "title": "Debug: Average Latency, milliseconds // 2024-05-03 09:33:00", "tags": [ "debug", "debug-table" ], "time": { "from": "2024-05-03T15:18:00.679Z", "to": "2024-05-03T15:33:00.680Z" } } ```

Environment (with versions)?

Grafana: 10.2.3 OSS OS: Docker image default Browser: Chrome 124, Firefox 125

Grafana platform?

Docker

Datasource(s)?

InfluxDB

danialre commented 2 weeks ago

One more note: influxdbBackendMigration is set to false but enabling it doesn't change this behavior. Also tested with the newest release (10.4.2) and this bug is still occurring.

cschlipf commented 1 week ago

I have the same issue here. Glad I am not the only one:

I want to get fields for each year:

image

However it always sets the Cell Value field name for every column:

image

Also using InfluxDB as data source

image

Grafana 10.4.2