Closed thecodeassassin closed 1 week ago
Hey! This is a common confusion between Kubernetes labels and Loki labels. Kubernetes labels on your pods do not automatically become labels in Loki, mostly because Loki can optimize based on common label sets.
If you want to add pod labels to your logs, you can add something like this:
logs:
pod_logs:
extraRelabelingRules: |
rule {
source_labels = ["__meta_kubernetes_pod_label_app_kubernetes_io_instance"]
action = "replace"
target_label = "instance"
}
This should set the app.kubernetes.io/instance
pod label to the instance
label on the logs.
This rule gets inserted into the discovery.relabel
component that is used to discover the pods to gather logs from. You can read the full syntax for the rules here: https://grafana.com/docs/alloy/latest/reference/components/discovery.relabel/
To find the meta labels that are available (like __meta_kubernetes_pod_label_app_kubernetes_io_instance
), you can look at this doc: https://grafana.com/docs/alloy/latest/reference/components/discovery.kubernetes/#pod-role
Thanks for the response!
Grafana agent used to just give me all labels and that's how we are used to querying our applications.
Any idea how we can just import all labels?
I encountered the same issue when migrating from Grafana Agent to k8s-monitoring. I fixed it using the following relabelingRule that I extracted from the old Grafana Agent config:
logs: pod_logs: extraRelabelingRules: | rule { action = "labelmap" regex = "__meta_kubernetes_pod_label_(.+)" }
With the configuration provided above added to k9s-monitoring chart configuration, all labels within the pods will be added as Loki labels:
that is exactly what I needed. This really needs to be documented somewhere. Thank you so much!
IMHO this should be the default, it was the default with grafana agent.
I get nervous about adding all labels by default. On pods with lots of kubernetes labels, you could easily start hitting Loki's limits of labels in the log message. Also, adding more labels reduces Loki's ability to store and query things efficiently.
That being said, I want to make this solution more discoverable. I'll update an example that we already have about adding pod labels for metrics to be about pod labels for metrics and for logs.
OK! I've updated this example which should help make setting log labels with pod labels more discoverable: https://github.com/grafana/k8s-monitoring-helm/pull/511
Labels are not being sent to loki:
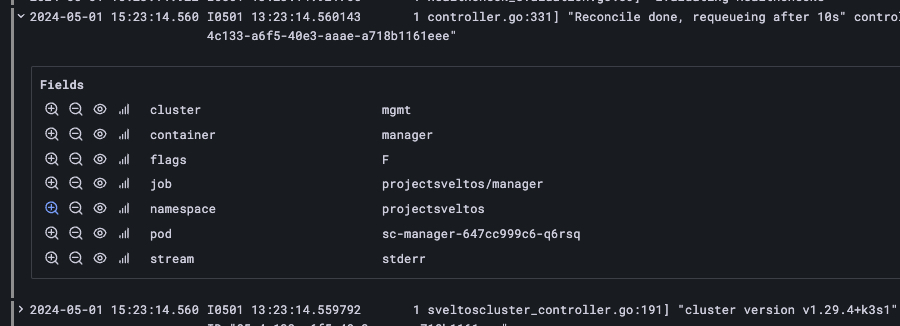
These labels are missing:
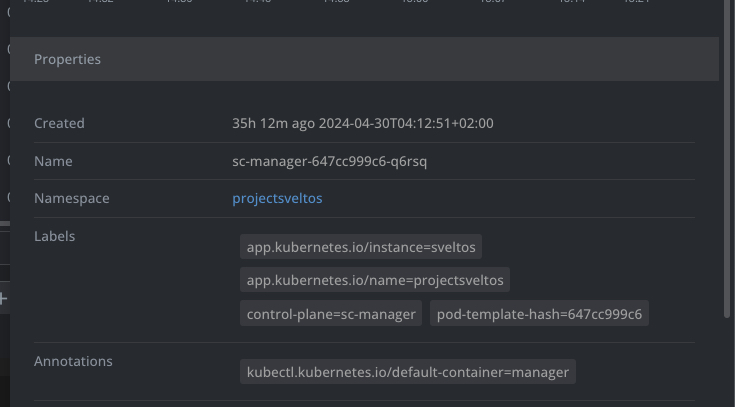
Config used: