I would like to show in a piechart-panel the TOP 5 values of a metric.
Query is as follows:
> SELECT top("max",host_name,5) FROM (SELECT max("value") FROM "metric_rta" WHERE time >= now() - 24h GROUP BY "host_name")
name: metric_rta
time                top        host_name
----                ---        ---------
1561971764000000000 198.057999 DNS1_Interno
1561982171000000000 121.943001 R1-bgp.a3sec.com
1561994807000000000 3000       www.a3sec.com
1562039065000000000 3000       DNS2_interno
1562054591000000000 97.637001  R7-bgp.a3sec.com
But when i chose piechart visualization I get all values in the pie:
Hi there,
I would like to show in a piechart-panel the TOP 5 values of a metric. Query is as follows:
But when i chose piechart visualization I get all values in the pie: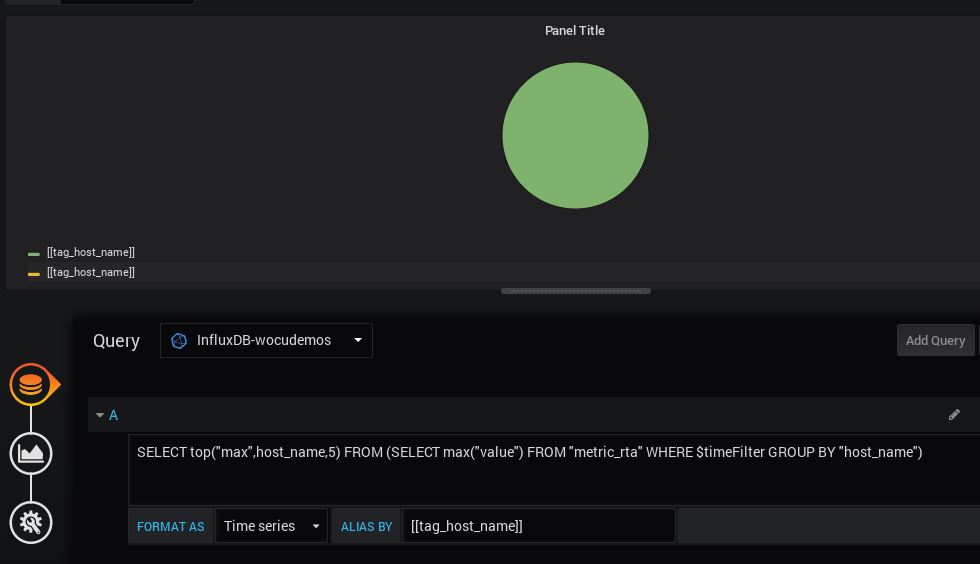
What am I missing?
Thanks in advance.