 joshhunt
commented
3 years ago
joshhunt
commented
3 years ago This actually isn't strictly a problem with the Azure Monitor datasource, but rather due to Azure Monitor being upgraded to use Data Frames, which the Pie Chart panel does not support for queries like this.
I'll move this to the Pie Chart repo so it can be tracked properly against that plugin. In the mean time, maybe consider whether there might be other panels to better visualise your data https://blog.funnel.io/why-we-dont-use-pie-charts-and-some-tips-on-better-data-visualizations
 KanchiSaiHemanth123
What happened: Beginning with Grafana version 7.1.0 we observe a wrong behavior when using the Azure Monitor plugin together with Log Analytics to query a time-series. For us it looks like as if as soon as the data contains more than a datetime + numeric value column the data is not handeled as a time-series anymore. In Grafana versions 7.0.6 and before it is handeled correctly.
What you expected to happen: We would expect that the query result is handeled as a time-series and not as a table if the data contains a datetime column, a numeric value column and a string (label) column. That behaviour is explained in the Grafana docs at: https://grafana.com/docs/grafana/latest/datasources/azuremonitor/#time-series-queries
How to reproduce it (as minimally and precisely as possible): That problem can be reproduced using the two expamples from the Grafana docs link.
To make things easier you can also use the following Log Analytics query and try visualize it using the piechart panel:
Not working in > v7.1.0, while working in v7.0.6:
Screenshot from Query Inspector on v7.3.6: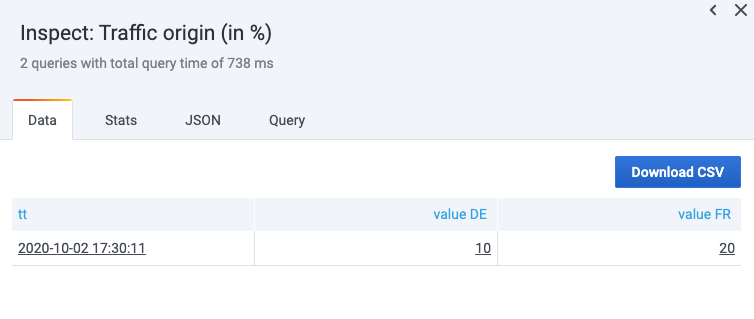 Panel error on v7.3.6:

Panel Data v7.3.6
{ "state": "Done", "series": [ { "fields": [ { "name": "tt", "type": "time", "values": { "_nullCount": -1, "_type": { "unit": 3, "timezone": null }, "_chunks": [ [ 1601652611000 ] ], "_chunkOffsets": { "0": 0, "1": 1 }, "_length": 1, "_numChildren": 0, "_field": { "name": "tt", "type": { "unit": 3, "timezone": null }, "nullable": false, "metadata": {} }, "_chunk": [ 1601652611000 ] }, "config": { "links": [ { "url": "###REDACTED###", "title": "View in Azure Portal", "targetBlank": true } ] }, "state": { "displayName": null, "scopedVars": { "__series": { "text": "Series", "value": { "name": "Series (A)" } }, "__field": { "text": "Field", "value": {} } }, "seriesIndex": 0 } }, { "name": "value", "type": "number", "values": { "_nullCount": -1, "_type": { "precision": 2 }, "_chunks": [ [ 10 ] ], "_chunkOffsets": { "0": 0, "1": 1 }, "_length": 1, "_numChildren": 0, "_field": { "name": "value", "type": { "precision": 2 }, "nullable": true, "metadata": {} }, "_chunk": [ 10 ] }, "config": { "links": [ { "url": "###REDACTED###", "title": "View in Azure Portal", "targetBlank": true } ], "min": 10, "max": 20 }, "labels": { "country": "DE" }, "state": { "displayName": null, "scopedVars": { "__series": { "text": "Series", "value": { "name": "Series (A)" } }, "__field": { "text": "Field", "value": {} } }, "calcs": { "sum": 10, "max": 10, "min": 10, "logmin": 10, "mean": 10, "last": 10, "first": 10, "lastNotNull": 10, "firstNotNull": 10, "count": 1, "nonNullCount": 1, "allIsNull": false, "allIsZero": false, "range": 0, "diff": 0, "delta": 0, "step": null, "previousDeltaUp": true }, "seriesIndex": 1 } }, { "name": "value", "type": "number", "values": { "_nullCount": -1, "_type": { "precision": 2 }, "_chunks": [ [ 20 ] ], "_chunkOffsets": { "0": 0, "1": 1 }, "_length": 1, "_numChildren": 0, "_field": { "name": "value", "type": { "precision": 2 }, "nullable": true, "metadata": {} }, "_chunk": [ 20 ] }, "config": { "links": [ { "url": "###REDACTED###", "title": "View in Azure Portal", "targetBlank": true } ], "min": 10, "max": 20 }, "labels": { "country": "FR" }, "state": { "calcs": { "sum": 20, "max": 20, "min": 20, "logmin": 20, "mean": 20, "last": 20, "first": 20, "lastNotNull": 20, "firstNotNull": 20, "count": 1, "nonNullCount": 1, "allIsNull": false, "allIsZero": false, "range": 0, "diff": 0, "delta": 0, "step": null, "previousDeltaUp": true }, "displayName": null, "scopedVars": { "__series": { "text": "Series", "value": { "name": "Series (A)" } }, "__field": { "text": "Field", "value": {} } }, "seriesIndex": 2 } } ], "length": 1, "refId": "A", "meta": { "custom": { "azureColumnTypes": [ "datetime", "string", "real" ], "subscription": "###REDACTED###", "workspace": "###REDACTED###", "encodedQuery": "H4sIAAAAAAAA/4TKMQrCUAwG4L2n+HlTCykkEZfM6gFcxSHaIIVnhWcqeHsn5+7f5Onptxp9pmHyjJyfQbi/1iXb1/DONi8PwsfrGoYWXjHg0v1pr6w8Co+skL3t2EQGQjkcC0GYNuHpXAjK3fUXAAD///nni3OLAAAA" }, "executedQueryString": "datatable(tt: datetime, country: string, value: real ) [\ndatetime(2020-10-02 15:30:11), \"DE\", 10,\ndatetime(2020-10-02 15:30:11), \"FR\", 20\n]" }, "table": { "_nullCount": -1, "_type": { "children": [ { "name": "tt", "type": { "unit": 3, "timezone": null }, "nullable": false, "metadata": {} }, { "name": "value", "type": { "precision": 2 }, "nullable": true, "metadata": {} }, { "name": "value", "type": { "precision": 2 }, "nullable": true, "metadata": {} } ] }, "_chunks": [ [ { "tt": 1601652611000, "value": 20 } ] ], "_chunkOffsets": { "0": 0, "1": 1 }, "_length": 1, "_numChildren": 3, "_schema": { "fields": [ { "name": "tt", "type": { "unit": 3, "timezone": null }, "nullable": false, "metadata": {} }, { "name": "value", "type": { "precision": 2 }, "nullable": true, "metadata": {} }, { "name": "value", "type": { "precision": 2 }, "nullable": true, "metadata": {} } ], "metadata": {}, "dictionaries": {} }, "_children": [ { "_nullCount": -1, "_type": { "unit": 3, "timezone": null }, "_chunks": [ [ 1601652611000 ] ], "_chunkOffsets": { "0": 0, "1": 1 }, "_length": 1, "_numChildren": 0, "_field": { "name": "tt", "type": { "unit": 3, "timezone": null }, "nullable": false, "metadata": {} }, "_chunk": [ 1601652611000 ] }, { "_nullCount": -1, "_type": { "precision": 2 }, "_chunks": [ [ 10 ] ], "_chunkOffsets": { "0": 0, "1": 1 }, "_length": 1, "_numChildren": 0, "_field": { "name": "value", "type": { "precision": 2 }, "nullable": true, "metadata": {} }, "_chunk": [ 10 ] }, { "_nullCount": -1, "_type": { "precision": 2 }, "_chunks": [ [ 20 ] ], "_chunkOffsets": { "0": 0, "1": 1 }, "_length": 1, "_numChildren": 0, "_field": { "name": "value", "type": { "precision": 2 }, "nullable": true, "metadata": {} }, "_chunk": [ 20 ] } ] } } ], "annotations": [], "request": { "app": "dashboard", "requestId": "Q235", "timezone": "browser", "panelId": 23763571993, "dashboardId": 2, "range": { "from": "2021-01-14T03:32:07.227Z", "to": "2021-01-14T09:32:07.227Z", "raw": { "from": "now-6h", "to": "now" } }, "timeInfo": "", "interval": "6h", "intervalMs": 21600000, "targets": [ { "appInsights": { "dimension": [ "none" ], "metricName": "select", "rawQuery": false, "rawQueryString": "", "spliton": "", "timeColumn": "timestamp", "timeGrain": "auto", "timeGrainType": "auto", "valueColumn": "", "yaxis": "" }, "azureLogAnalytics": { "query": "datatable(tt: datetime, country: string, value: real ) [\ndatetime(2020-10-02 15:30:11), \"DE\", 10,\ndatetime(2020-10-02 15:30:11), \"FR\", 20\n]", "resultFormat": "time_series", "workspace": "###REDACTED###" }, "azureMonitor": { "aggOptions": [], "dimensionFilter": "*", "dimensionFilters": [], "metricDefinition": "select", "metricName": "select", "metricNamespace": "select", "resourceGroup": "select", "resourceName": "select", "timeGrain": "auto", "timeGrains": [], "top": "10" }, "hide": false, "insightsAnalytics": { "query": "datatable(tt: datetime, value: long, country: string) [\ndatetime(2020-10-02 15:30:11), 10, \"DE\",\ndatetime(2020-10-02 15:30:11), 20, \"FR\"\n]", "resultFormat": "time_series" }, "queryType": "Azure Log Analytics", "refId": "A", "subscription": "###REDACTED###", "datasource": "Azure" } ], "maxDataPoints": 1, "scopedVars": { "__interval": { "text": "6h", "value": "6h" }, "__interval_ms": { "text": "21600000", "value": 21600000 } }, "cacheTimeout": null, "startTime": 1610616727228, "rangeRaw": { "from": "now-6h", "to": "now" }, "endTime": 1610616727398 }, "timeRange": { "from": "2021-01-14T03:32:07.399Z", "to": "2021-01-14T09:32:07.399Z", "raw": { "from": "now-6h", "to": "now" } }, "timings": { "dataProcessingTime": 0.3499999949708581 } }Screenshot from Query Instector on v7.0.6: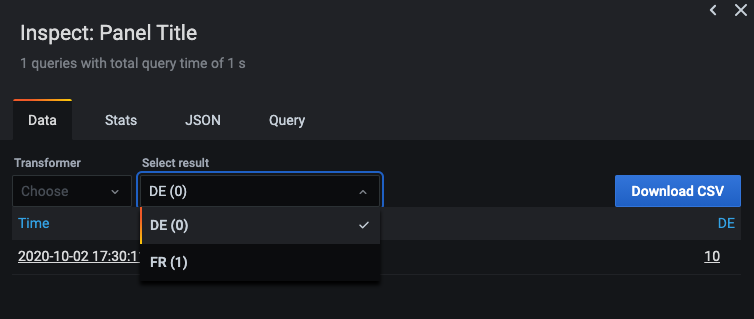 Panel on v7.0.6:
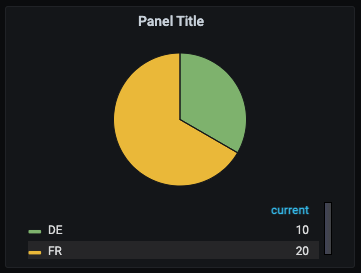
Panel Data v7.0.6
{
  "state": "Done",
  "series": [
    {
      "name": "DE",
      "refId": "A",
      "meta": {
        "columns": [
          {
            "name": "tt",
            "type": "datetime"
          },
          {
            "name": "country",
            "type": "string"
          },
          {
            "name": "value",
            "type": "real"
          }
        ],
        "subscription": "###REDACTED###",
        "workspace": "###REDACTED###",
        "query": "datatable(tt: datetime, country: string, value: real ) [\ndatetime(2020-10-02 15:30:11), \"DE\", 10,\ndatetime(2020-10-02 15:30:11), \"FR\", 20\n]",
        "encodedQuery": "H4sIAAAAAAAA/4TKMQrCUAwG4L2n+HlTCykkEZfM6gFcxSHaIIVnhWcqeHsn5+7f5Onptxp9pmHyjJyfQbi/1iXb1/DONi8PwsfrGoYWXjHg0v1pr6w8Co+skL3t2EQGQjkcC0GYNuHpXAjK3fUXAAD///nni3OLAAAA"
      },
      "fields": [
        {
          "name": "Time",
          "type": "time",
          "config": {
            "links": [
              {
                "url": "###REDACTED###",
                "title": "View in Azure Portal",
                "targetBlank": true
              }
            ],
            "unit": "time:YYYY-MM-DD HH:mm:ss"
          },
          "values": [
            1601652611000
          ],
          "state": {
            "displayName": "Time",
            "scopedVars": {
              "__series": {
                "text": "Series",
                "value": {
                  "name": "DE"
                }
              },
              "__field": {
                "text": "Field",
                "value": {
                  "name": "Time",
                  "formattedLabels": ""
                }
              }
            }
          }
        },
        {
          "name": "Value",
          "type": "number",
          "config": {
            "links": [
              {
                "url": "###REDACTED###",
                "title": "View in Azure Portal",
                "targetBlank": true
              }
            ]
          },
          "values": [
            10
          ],
          "state": {
            "displayName": "DE",
            "scopedVars": {
              "__series": {
                "text": "Series",
                "value": {
                  "name": "DE"
                }
              },
              "__field": {
                "text": "Field",
                "value": {
                  "name": "DE",
                  "formattedLabels": ""
                }
              }
            },
            "calcs": {
              "sum": 10,
              "max": 10,
              "min": 10,
              "logmin": 10,
              "mean": 10,
              "last": 10,
              "first": 10,
              "lastNotNull": 10,
              "firstNotNull": 10,
              "count": 1,
              "nonNullCount": 1,
              "allIsNull": false,
              "allIsZero": false,
              "range": 0,
              "diff": 0,
              "delta": 0,
              "step": null,
              "previousDeltaUp": true
            }
          }
        }
      ],
      "length": 1
    },
    {
      "name": "FR",
      "refId": "A",
      "meta": {
        "columns": [
          {
            "name": "tt",
            "type": "datetime"
          },
          {
            "name": "country",
            "type": "string"
          },
          {
            "name": "value",
            "type": "real"
          }
        ],
        "subscription": "###REDACTED###",
        "workspace": "###REDACTED###",
        "query": "datatable(tt: datetime, country: string, value: real ) [\ndatetime(2020-10-02 15:30:11), \"DE\", 10,\ndatetime(2020-10-02 15:30:11), \"FR\", 20\n]",
        "encodedQuery": "H4sIAAAAAAAA/4TKMQrCUAwG4L2n+HlTCykkEZfM6gFcxSHaIIVnhWcqeHsn5+7f5Onptxp9pmHyjJyfQbi/1iXb1/DONi8PwsfrGoYWXjHg0v1pr6w8Co+skL3t2EQGQjkcC0GYNuHpXAjK3fUXAAD///nni3OLAAAA"
      },
      "fields": [
        {
          "name": "Time",
          "type": "time",
          "config": {
            "links": [
              {
                "url": "###REDACTED###",
                "title": "View in Azure Portal",
                "targetBlank": true
              }
            ]
          },
          "values": [
            1601652611000
          ],
          "state": {
            "displayName": "Time",
            "scopedVars": {
              "__series": {
                "text": "Series",
                "value": {
                  "name": "FR"
                }
              },
              "__field": {
                "text": "Field",
                "value": {
                  "name": "Time",
                  "formattedLabels": ""
                }
              }
            }
          }
        },
        {
          "name": "Value",
          "type": "number",
          "config": {
            "links": [
              {
                "url": "###REDACTED###",
                "title": "View in Azure Portal",
                "targetBlank": true
              }
            ]
          },
          "values": [
            20
          ],
          "state": {
            "displayName": "FR",
            "calcs": {
              "sum": 20,
              "max": 20,
              "min": 20,
              "logmin": 20,
              "mean": 20,
              "last": 20,
              "first": 20,
              "lastNotNull": 20,
              "firstNotNull": 20,
              "count": 1,
              "nonNullCount": 1,
              "allIsNull": false,
              "allIsZero": false,
              "range": 0,
              "diff": 0,
              "delta": 0,
              "step": null,
              "previousDeltaUp": true
            },
            "scopedVars": {
              "__series": {
                "text": "Series",
                "value": {
                  "name": "FR"
                }
              },
              "__field": {
                "text": "Field",
                "value": {
                  "name": "FR",
                  "formattedLabels": ""
                }
              }
            }
          }
        }
      ],
      "length": 1
    }
  ],
  "request": {
    "app": "dashboard",
    "requestId": "Q126",
    "timezone": "browser",
    "panelId": 23763571993,
    "dashboardId": 26,
    "range": {
      "from": "2021-01-14T03:20:33.874Z",
      "to": "2021-01-14T09:20:33.875Z",
      "raw": {
        "from": "now-6h",
        "to": "now"
      }
    },
    "timeInfo": "",
    "interval": "6h",
    "intervalMs": 21600000,
    "targets": [
      {
        "refId": "A",
        "queryType": "Azure Log Analytics",
        "azureMonitor": {
          "resourceGroup": "select",
          "metricDefinition": "select",
          "resourceName": "select",
          "metricNamespace": "select",
          "metricName": "select",
          "dimensionFilter": "*",
          "timeGrain": "auto",
          "top": "10",
          "aggOptions": [],
          "timeGrains": []
        },
        "azureLogAnalytics": {
          "query": "datatable(tt: datetime, country: string, value: real ) [\ndatetime(2020-10-02 15:30:11), \"DE\", 10,\ndatetime(2020-10-02 15:30:11), \"FR\", 20\n]",
          "resultFormat": "time_series",
          "workspace": "###REDACTED###"
        },
        "appInsights": {
          "metricName": "select",
          "rawQuery": false,
          "rawQueryString": "",
          "dimension": "none",
          "timeGrain": "auto",
          "timeColumn": "timestamp",
          "valueColumn": ""
        },
        "subscription": "###REDACTED###",
        "datasource": "Azure"
      }
    ],
    "maxDataPoints": 1,
    "scopedVars": {
      "__interval": {
        "text": "6h",
        "value": "6h"
      },
      "__interval_ms": {
        "text": "21600000",
        "value": 21600000
      }
    },
    "startTime": 1610616033876,
    "rangeRaw": {
      "from": "now-6h",
      "to": "now"
    },
    "endTime": 1610616035069
  },
  "timeRange": {
    "from": "2021-01-14T03:20:35.069Z",
    "to": "2021-01-14T09:20:35.069Z",
    "raw": {
      "from": "now-6h",
      "to": "now"
    }
  },
  "timings": {
    "dataProcessingTime": 0.15999999595806003
  }
}
Anything else we need to know?: In the Grafana support forum another member had an issue which I think is related to our issue: https://community.grafana.com/t/azure-monitor-updating-queries-to-match-behavior-differences-after-upgrading-grafana/38355 In our case changing the order has no effect.
Environment: