 hafen
commented
6 years ago
hafen
commented
6 years ago Thanks! This has been added.
Closed JoseAntonioOrtega closed 6 years ago
hafen
commented
6 years ago Thanks! This has been added.
hafen
commented
5 years ago 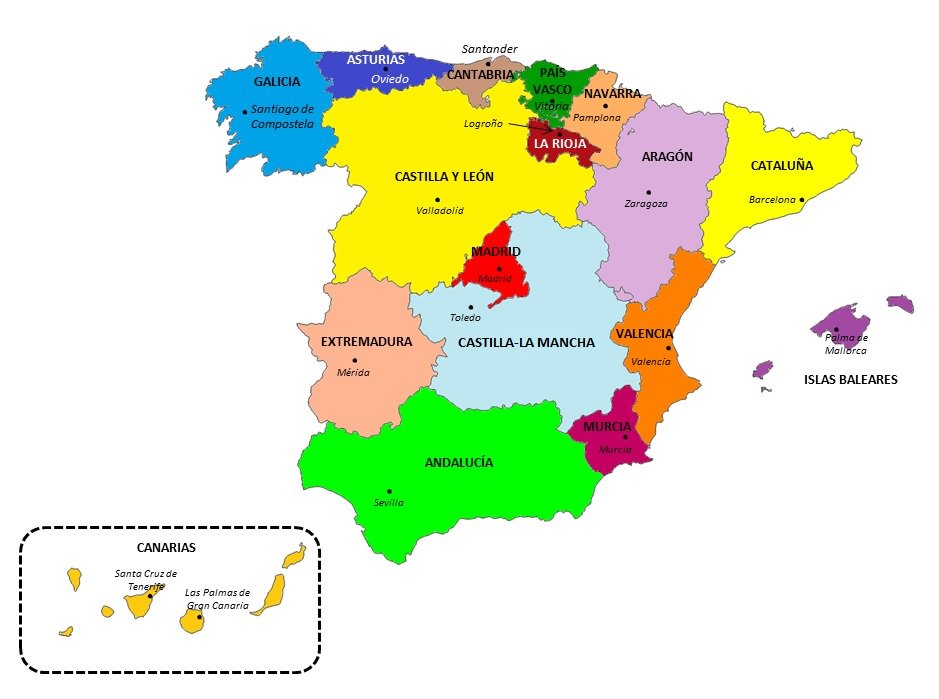
Spanish "Comunidades Autónomas"
No completely satisfactory grid possible due to size heterogeneity. This provides a balances in terms of shape, and minimum size, but some regions do not share limits.
Example of code:
library(tidyverse) pop=pxR::read.px("http://www.ine.es/jaxiT3/files/t/en/px/2853.px") %>% as.data.frame(use.codes=TRUE) %>% as_tibble
pop %>% filter(Sex!="Total") %>% mutate(Period=Period %>% as.character %>% as.numeric, code=Autonomous.Communities.and.Cities %>% substring(3,4)) %>%
ggplot(aes(x=Period,y=log(value),group=Sex,color=Sex))+ geom_line()+ facet_geo(~code, grid=spain_ccaa_grid1,label="name") + labs(title="Population by sex (log scale)",subtitle="Source: www.ine.es")
Grid data: