 mithro
commented
3 years ago
mithro
commented
3 years ago Open mithro opened 3 years ago
mithro
commented
3 years ago  umarcor
commented
3 years ago
umarcor
commented
3 years ago Absolutely agree. As we have discussed before, I've also been drawing some diagrams, feeding forth and back to yours. This is the one for synthesis and PnR:

And this is WIP for HDL-centric simulation and verification (from umarcor.github.io/osvb):

My main concern is that, if we added such flow views to the site, I believe they must be interactive:
Therefore, the limitation is technical on my side. I know how to do 1 using SVG "manually". I believe I can easily find some example about how to do 2. Yet, 3. requires expertise on web frontend design.
Ideally, I'd like to generate the diagrams programmatically, as I find so frustrating to spend time routing the signals or setting styles. I'm quite comfortable with TikZ (see https://texample.net/tikz/examples/). Unfortunately, AFAIAA, TikZ/LaTeX is for generating PS/DVI/PDF, not easily usable for SVG (or other web-friendly formats). I've tried SVG generation libraries (I did a golang version of wavedrom), but none of them provides the relative positioning and edge routing features available in TikZ. You need to first build your own utility library.
We are experimenting with Graphviz/dot in https://hdl.github.io/containers/#_graph. At the moment *.dot files are written manually. It would not be difficult to generate them automatically. The limitation for doing so is that extracting the logic of the graphs from repo sources is not machine-friendly. It's rather intuitive for humans, but there's lots of parsing involved for computers. A similar constraint would apply here. Therefore, there is no much value in maintaining a description of the graphs which is agnostic to the drawing engine. We'd better use a "graph" language directly. Yet, I'm not convinced about Graphviz because, unlike TikZ, positioning nodes is not trivial.
Any reference/suggestion/proposal is very welcome.
 Paebbels
commented
3 years ago
Paebbels
commented
3 years ago I patched once a Sphinx plugin to utilize https://github.com/ariutta/svg-pan-zoom for a SVG (was it Wavedrom classdiagrams, I don't remember ...).
Paebbels
commented
3 years ago I don't recommend GraphViz / dot. I'ts good for masses of data and connections, but not for stractured layout / good looking. I use yEd for this, here nodes have sizes and coordinates. I can generate svg, png, pdf, ... (@umarcor the diagram I showed you in our last meeting was done in yEd) See Galery for what people did with yEd.
umarcor
commented
3 years ago @Paebbels, thanks for the refs. the diagrams above were done with draw.io, which is a natural competitor of yEd. In fact, draw.io was formerly named jgraph/mxgraph, and it was not open source. Then, they open sourced it and creatred daw.io. However, I don't think that yEd or draw.io can help much generating diagrams programmatically. I found the APIs to be quite low-level, for you to write your app on top of them. So, doable, but not straightforward. In practice, we use them graphically, just as gdocs's drawings.
Paebbels
commented
3 years ago @umarcor I create graphml files directly via Python script an xml template snippets. So I have templates for nodes and edges and they are written to a file. We can have a meeting on how I do it.
I also found:
but never used either tool.
mithro
commented
3 years ago @umarcor Can you fix the black background on your verification image?
umarcor
commented
3 years ago @mithro done.
 rodrigomelo9
commented
3 years ago
rodrigomelo9
commented
3 years ago Hi. I really love this idea :-) I am not precisely an expert with frontend things XD, but if we found the right tool I can try :P
 cmarqu
commented
3 years ago
cmarqu
commented
3 years ago @drom might have input here.
umarcor
commented
3 years ago umarcor
commented
3 years ago Based on the first diagram in https://github.com/hdl/awesome/issues/98#issuecomment-772216112, I created a dot graph. See https://github.com/hdl/awesome/tree/develop/todo/map. The output is awful. However, the information (nodes, edges, and clusters) is there, in case someone wants to experiment with automatic layouts. There are some references in https://hdl.github.io/containers/#_graph_generationparsing.
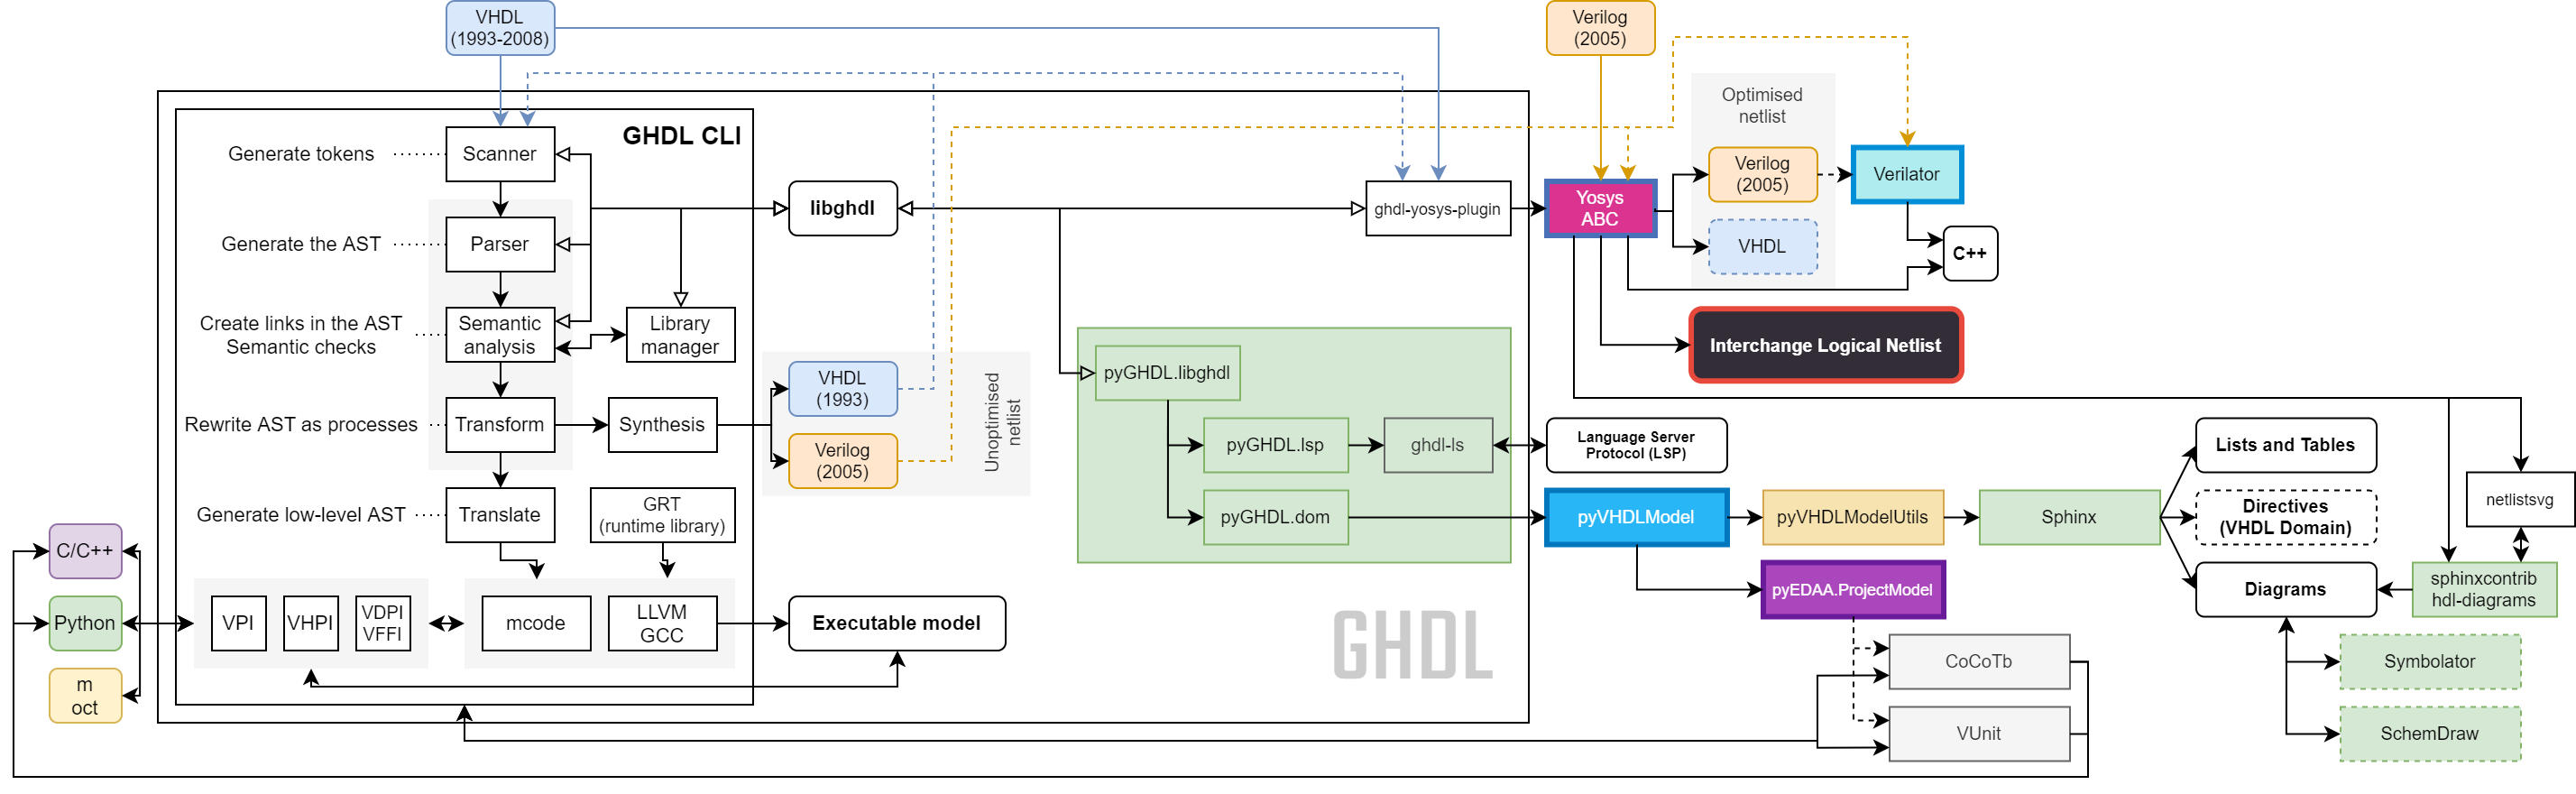
umarcor
commented
2 years ago An updated diagram of "GHDL as a VHDL toolkit" for simulation, synthesis, LSP, documentation...
It would be really nice if the site had a "flow" view.
See the diagram at http://j.mp/openfpga-diagram and https://symbiflow.readthedocs.io/en/latest/toolchain-desc/design-flow.html and https://symbiflow.readthedocs.io/en/latest/introduction.html