holoviz / geoviews

Simple, concise geographical visualization in Python
http://geoviews.org
BSD 3-Clause "New" or "Revised" License
592 stars 76 forks source link

Inconsistent xarray dimensions use between holoviews and geoviews #81

Closed michaelaye closed 6 years ago

michaelaye commented 7 years ago

The same data is being plotted differently into an Image using either holoviews or geoviews. Is this related to how geoviews uses boundaries, a mention I find in just one line of the docs of geoviews when comparing to the Iris library?

Here's how I create the datasets:

kdims = ['simtime', 'lyr_mid', ('lon', 'Longitude'), ('lat','Latitude')]
vdims = ['wind_mag', 'wind_dir']
xr_dataset = gv.Dataset(xr_ensemble, kdims=kdims, vdims=vdims, crs=crs.PlateCarree())
hv_dataset = hv.Dataset(xr_ensemble, kdims=kdims, vdims=vdims)

Here's the geoviews Image plot:

%%opts Image [aspect=1.5]
xr_dataset.select(simtime=(24096,24098)).to(gv.Image, ['lon', 'lat'], 'wind_mag')

screenshot 2017-07-29 16 12 08

and here the holoviews Image plot:

%%opts Image [aspect=1.5]
hv_dataset.select(simtime=(24096,24098)).to(hv.Image, ['lon', 'lat'], 'wind_mag')

screenshot 2017-07-29 16 13 24

As you can see the latitude has 4 bins, and all bins are shown in the holoviews Image plot, but the geoviews Image plot is using the value of the first latitude dimension, 70, as a boundary instead of centering the bin around that number, which is how this netCDF data was compiled.

How can I make geoviews treat the data the same way holoviews already does?

Here's the .coords view of the xarray object:

Coordinates:
  * lyr_mid  (lyr_mid) float64 0.992 0.9975 0.9995
  * lon      (lon) float64 -180.0 -174.0 -168.0 -162.0 -156.0 -150.0 -144.0 ...
  * lat      (lat) float64 -85.0 -80.0 -75.0 -70.0
  * simtime  (simtime) float64 2.41e+04 2.41e+04 2.41e+04 2.41e+04 2.41e+04 ...

My system data:

lukasbindreiter commented 6 years ago

Any updates on this?

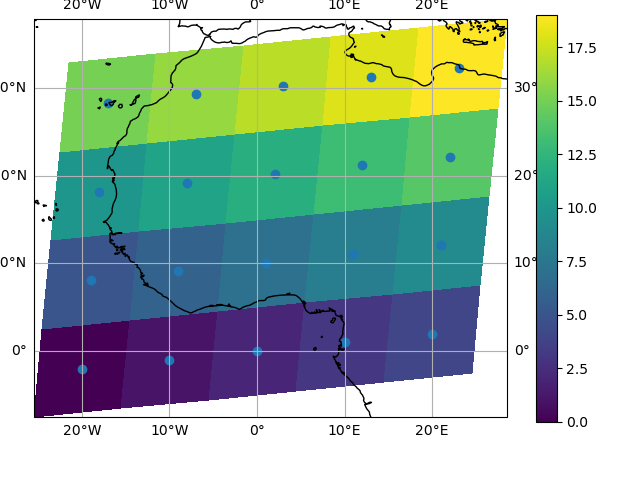
This definetly looks like an issue in boundary calculation. If you look at the latitude axis, it ranges from -70 to -85 in geoviews and from -65 to -90 in holoviews.

X Array has images in their documentation which nicely illustrate the difference: Images taken from here

Without bounds calculation

Without bounds

With bounds calculation

With bounds

In X-Array you can change this behaviour by specifying the infer_intervals argument, which uses this underlying function: _infer_interval_breaks

michaelaye commented 6 years ago

What needs to be done here? I'd like this to work but have not enough insight in geoviews/holoviews to repair this without help/guidance.

philippjfr commented 6 years ago

I'll try to have a look at this soon. In general we assume that the coordinates specify the bin centers but it's definitely possible that the matplotlib plotting classes don't do so now.

philippjfr commented 6 years ago

Okay, inferring the interval breaks is definitely the correct approach here, and when adding support for irregular meshes I actually added that utility to HoloViews. I'm going to be porting QuadMesh to geoviews to add support for such meshes and can make the changes then. Alternatively I'd be happy to see a PR that uses hv.core.data.GridInterface._infer_interval_breaks on the coordinate arrays in gv.plotting.mpl.GeoImagePlot.

philippjfr commented 6 years ago

Added the fix to #116, would appreciate it if you had the time to test it (note you'll also need HoloViews master).

philippjfr commented 6 years ago

The fix was merged in the referenced PR, closing.

michaelaye commented 6 years ago

Trying to test this, got 38d56d1 and did

pip install -e .

but after importing geoviews I get

ImportError: cannot import name 'TriMesh'
michaelaye commented 6 years ago

oh, is that the Holoviews master requirement, I guess?

Update: Yes, it was. Imports fine now.