 ghost
commented
2 years ago
ghost
commented
2 years ago Using 30fps cheat code it doesn't crash o_O BTW here's my savestate ppsspp_state.zip
Open ghost opened 2 years ago
ghost
commented
2 years ago Using 30fps cheat code it doesn't crash o_O BTW here's my savestate ppsspp_state.zip
 TypeZSketcher
commented
2 years ago
TypeZSketcher
commented
2 years ago Change PPSSPP CPU Clock To 222MHz, Idk Why But It's Could Fixed Bugs Or Crashing For God Of War : Ghost Or Sparta.
ghost
commented
2 years ago Change PPSSPP CPU Clock To 800MHz, Idk Why But It's Could Fixed Bugs Or Crashing For God Of War : Ghost Or Sparta.
Did you try? It is work for you in that area? Im using IR Interpreter cpu btw.
TypeZSketcher
commented
2 years ago Yes. I Got That Bug Too At PC And Android...
TypeZSketcher
commented
2 years ago Anyways, That Method Can Used To Fixed Unlimited Enemy At The Vortex Area
ghost
commented
2 years ago Anyways, That Method Can Used To Fixed Unlimited Enemy At The Vortex Area
Unlimited enemy is a different issue.
ghost
commented
2 years ago  Can fix this issue if I enable that in jit debug tools.
 hrydgard
commented
2 years ago
hrydgard
commented
2 years ago Hm, very much looks like a dupe of https://github.com/hrydgard/ppsspp/issues/6982 ? Which still is an issue indeed.
 unknownbrackets
commented
2 years ago
unknownbrackets
commented
2 years ago What's the minimum disable flags required to avoid the issue? Does it require all three of those? LSU_UNALIGNED is flipped (oops, will fix), but shouldn't do anything if LSU is disabled.
-[Unknown]
ghost
commented
2 years ago I disable those 3 option to prevent from crashing when I load savestate but now LSU is enough to prevent from crash using the latest build 🤔
unknownbrackets
commented
2 years ago In that case, RemoveLoadStoreLeftRight is my top theory I suppose. I don't think it's LSU directly? L/R stuff is complicated...
-[Unknown]
ghost
commented
2 years ago I also notice a CPU glitch after Kratos jump down.
 anr2me
commented
2 years ago
anr2me
commented
2 years ago Using 30fps cheat code it doesn't crash o_O BTW here's my savestate ppsspp_state.zip
i'm using this save state without disabling any JIT functionality, and the crash occurred here:

Unhandled exception thrown: read access violation.
Memory::base was 0x111028900FD01A6.
May be alignment issue?
Will using static address (or at least with a lot of 0x0000 at the end of base address) can help avoid alignment issue? https://github.com/hrydgard/ppsspp/issues/15601
Nevermind, the Memory::base address shown in the exception is different than the base value which is 0x00000177ffec0000 so there shouldn't be alignment issue with such address.

With LSU disabled, ppsspp didn't crashed, only the game crashed
 Disabling LSU_UNALIGNED or VFPU_XFER didn't have any effects and still crashing ppsspp
Dynarec(JIT) without disabling any JIT functionality also crashing the game:
 May be the save state was already corrupted...
Edit: Apparently i need to enable "Ignore bad memory access" combined with Disabled LSU to prevent the game from crashing
unknownbrackets
commented
2 years ago It could be already corrupt. You're also getting the purple screen which means that something dangerous was done with this save state at some point (i.e. cheats, etc.)
It might be best to get a save state near this area using jit and see if it reproduces on IR interpreter. And see if IR crashes from a regular in-game save.
-[Unknown]
anr2me
commented
2 years ago @Gamemulatorer could you provide a cleaner save state? may be loading it from save data first and not using any cheat when creating the save state
ghost
commented
2 years ago I will try later :)
ghost
commented
2 years ago Can still reproduce.

 Zmashed
commented
1 year ago
Zmashed
commented
1 year ago Sadly, I'm still getting stuck at this point in the game. I tried all the above and still no dice :(
unknownbrackets
commented
1 year ago Was anyone able to upload a clean save state (it would show blue, not purple, on crash)?
-[Unknown]
 vampy911
commented
1 year ago
vampy911
commented
1 year ago the solution is : Go into "Settings", then "System" and uncheck "Fast Memory (unstable)."
You might want to create a Game Setting for this game with that option turned off...
vampy911
commented
1 year ago Was anyone able to upload a clean save state (it would show blue, not purple, on crash)?
-[Unknown]
check my comment
vampy911
commented
1 year ago Sadly, I'm still getting stuck at this point in the game. I tried all the above and still no dice :(
check my comment!
anr2me
commented
1 year ago Was anyone able to upload a clean save state (it would show blue, not purple, on crash)? -[Unknown]
yes check my comment
please upload your clean save state here so the devs can test it, and they can fix it if it really related to fast memory, because fast memory shouldn't cause a crash.
vampy911
commented
1 year ago please upload your clean save state here so the devs can test it, and they can fix it if it really related to fast memory, because fast memory shouldn't cause a crash.
I don't think I've saved it in that spot tbh. I'm way ahead now. But when I unchecked fast memory it genuinely worked and I've seen that solution on Reddit so I thought id share it since it worked for me as well as others :). If you want any save state after this crash I'll sent it for sure
unknownbrackets
commented
1 year ago The best way to fix this issue so that no one has to fiddle with settings would be if we can get a save or save state that is, ideally, just before you enter the area (but close) where this happens. Fixing this bug will most likely mean reproducing it tens of times, although if it's too close to the issue the bug may already be "set in stone."
Not asking anyone to go back or anything, but just describing what a developer (such as myself) will need to fix the bug.
I'm not actually interested in playing this game, so not asking for a workaround. It's possible the same underlying bug might break the game later (and maybe turning off this setting won't work as a workaround for that case), or might break other games. That's my main interest in this bug.
-[Unknown]
ghost
commented
1 year ago the solution is : Go into "Settings", then "System" and uncheck "Fast Memory (unstable)."
You might want to create a Game Setting for this game with that option turned off...
That doesn't help using IR interpreter on my device 🤷
vampy911
commented
1 year ago vampy911
commented
1 year ago The best way to fix this issue so that no one has to fiddle with settings would be if we can get a save or save state that is, ideally, just before you enter the area (but close) where this happens. Fixing this bug will most likely mean reproducing it tens of times, although if it's too close to the issue the bug may already be "set in stone."
Not asking anyone to go back or anything, but just describing what a developer (such as myself) will need to fix the bug.
I'm not actually interested in playing this game, so not asking for a workaround. It's possible the same underlying bug might break the game later (and maybe turning off this setting won't work as a workaround for that case), or might break other games. That's my main interest in this bug.
-[Unknown]
I uploaded it, let me know if this helps?
vampy911
commented
1 year ago Was anyone able to upload a clean save state (it would show blue, not purple, on crash)? -[Unknown]
yes check my comment
please upload your clean save state here so the devs can test it, and they can fix it if it really related to fast memory, because fast memory shouldn't cause a crash.
Uploaded :)
vampy911
commented
1 year ago the solution is : Go into "Settings", then "System" and uncheck "Fast Memory (unstable)." You might want to create a Game Setting for this game with that option turned off...
That doesn't help using IR interpreter on my device 🤷
if anyone wants a save state for right after this bug so they can play, let me know ill upload it :)
ghost
commented
1 year ago Ok finally got a new savestate and a blue print crash log.

anr2me
commented
1 year ago Ok finally got a new savestate and a blue print crash log.
btw, what should i do after loading the save state in order to go to the problematic scene?
PS: ugh i only get 1/60 FPS when running this game on debug build directly from visual studio :( oops i forgot i have software rendering enabled
vampy911
commented
1 year ago Climb the wall on your left by clicking X then keep climbing up more until you see this huge electrocuted creature in the bottom. They'll ask you to click L to get down, that's when you should get the crash.

vampy911
commented
1 year ago Ok finally got a new savestate and a blue print crash log.
btw, what should i do after loading the save state in order to go to the problematic scene?
PS: ugh i only get 1/60 FPS when running this game on debug build directly from visual studio :(
Watch from 12:11 to understand how it's done. (https://youtu.be/iRp8f0AU2Xg)
anr2me
commented
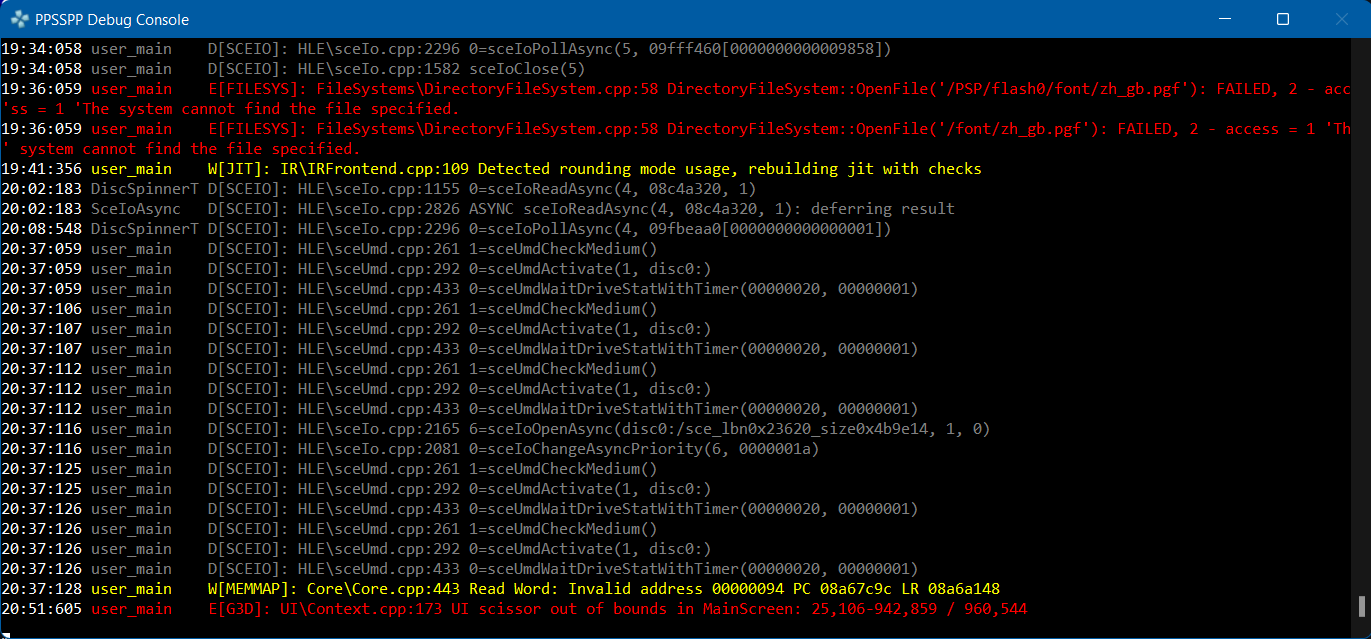
1 year ago Okay, using save state, this is the location of the crash when using IR without disabling any JIT functionality

With fastmem and ignore bad memory access disabled, the blue screen occurred with this logs
 I remembered seeing a weird polygon (like stretched out of the body) around at the same time where the bad memory access occurrence in the past, but didn't see that weird polygon anymore when i tested it on the latest master (need to disable LSU and enable ignore bad memory access to prevent the crash, thus can see the weird polygon in the past)
unknownbrackets
commented
1 year ago Knowing that it crashes in the IR interpreter runloop isn't useful. Think of it this way: imagine I wrote this code:
enum StepType {
   READ,
   WRITE,
};
struct Step {
   StepType type;
   int offset;
}

uint32_t data[32];

uint32_t RunSteps(std::vector<Step> &steps) {
    uint32_t value;
    for (auto &step : steps) {
        if (step.type == READ)
            value = data[step.offset];
        else
            data[step.offset] = value;
    }

    return value;
}
That's a tiny state machine, with 128 bytes of RAM. It's like a much less complex example of the IR runloop.
Now let's say I call this with:
steps.push_back({ READ, 0 });
steps.push_back({ WRITE, 1 });
steps.push_back({ WRITE, 2 });
Everything would be okay, right? It could run that and return whatever was in position 0 in RAM, having updated the other two words in RAM.
But what if I did this?
steps.push_back({ READ, 9999 });
steps.push_back({ WRITE, 1 });
steps.push_back({ WRITE, 2 });
Oh no. I've accessed outside valid RAM - my program crashes. Surely, we could all agree: I could complicate my little state machine by checking if the offset is >= 32. Since I only have 128 bytes of RAM, that's not allowed. Yay, it doesn't crash... but it also doesn't work. Darn. And it just behaves wrong (not loading the right thing at that 9999 line), but I can't tell why because it's silent about the error.
That's a problem. So now, let's say I make the state machine a bit more complicated. Instead of only checking for offset >= 32, I show a blue screen and an error message when offset is >= 32. There we go. Now I know that someone called RunSteps() with bad parameters. The bug obviously isn't in RunSteps, but now it tells me at least some info.
That's what's happening here. That IROp::Load32 crashes when provided an invalid address is neither surprising or even interesting. That's about is eventful a finding as water being a liquid. We know that already so well we already created blue screens about it: it's settled science.
What's interesting is: why did the MIPS code send an address that is wrong? The answer to this question won't be under case IROp::Load32:. What we're looking for is basically that steps.push_back({ READ, 9999 }); line (which itself didn't crash) which caused this whole mess. Unfortunately, because MIPS can read values, and construct new offsets based on adding other values, it's really not so simple where it went wrong.
-[Unknown]
unknownbrackets
commented
1 year ago For me this appears unrelated to IR - even disabling everything in IR, it still happens (at least from the save, even without using a save state.) It seemed to happen less often (?) in interpreter but happened there too.
If this issue is just "using the IR interpreter doesn't let me ignore bad memory addresses", I think there's another issue for it. But anyway, the real bug is the crash, which seems to happen for interpreter, IR interpreter, and jit.
The crash occurs at 08A67CA8 for me, because the load at 08A67C9C read nullptr, reading from e.g. 0918832C or 097B16EC (it varies.) It seems like this nullptr is written at 08B01734, overwriting 0x09188340 (or etc.) Even if I put that value back, it just crashes later.
When it didn't crash (it doesn't always), 08B016F8 ran (with the address of the nullptr read) but there was a correct value loaded in its place. It seems like the timing of it vs 08A67C64 running is what was different?
That it's affected by CPU clock makes it seem more likely it's timing. At certain Mhz values (for example 200 Mhz) it seems nearly impossible to reproduce the crash.
08A6A080 instigates the crash when: [[[a0 + 0x78] + 0x34] + 0x2c] == 0.
Comparing the working mhz with broken mhz... I see some IO stuff happening on broken before the call to 08a67c64 with the nullptr. It starts this IO stuff after the nullptr is written, which is the same as working - except that working doesn't call 08A67C64 again after starting the IO. But also, 08A67C64 is called 6 times in working, and 8 times + 1 crash in broken.
As an experiment, if I multiply the return of EstimatePerVertexCost() by 10, it doesn't crash anymore (although FPS is bad.) Even doubling it is enough, although that still hurts FPS of course.
Changing sceIoOpen timing doesn't seem to help. Increasing VFPU op cycles significantly doesn't seem to help.
Seems like improving GE timing in some way is the best bet here.
Useful save state (immediately before the crash, crashes at 333 Mhz, doesn't crash at 200 Mhz): UCUS98737_2.00_4.zip
-[Unknown]
ghost
commented
1 year ago Another crashlog using IRinterpreter
Softversion: PD1930CF_EX_A_6.8.55
03-05 19:02:57.029 22839 22839 F DEBUG   : Time: 2023-03-05 19:02:57
03-05 19:02:57.029 22839 22839 F DEBUG   : *** *** *** *** *** *** *** *** *** *** *** *** *** *** *** ***
03-05 19:02:57.029 22839 22839 F DEBUG   : Build fingerprint: 'vivo/1906/1906:11/RP1A.200720.012/compiler0316164337:user/release-keys'
03-05 19:02:57.029 22839 22839 F DEBUG   : Revision: '0'
03-05 19:02:57.029 22839 22839 F DEBUG   : ABI: 'arm64'
03-05 19:02:57.029 22839 22839 F DEBUG   : Timestamp: 2023-03-05 19:02:57+0800
03-05 19:02:57.029 22839 22839 F DEBUG   : pid: 22184, tid: 22827, name: Thread-5  >>> org.ppsspp.ppsspp <<<
03-05 19:02:57.029 22839 22839 F DEBUG   : uid: 10398
03-05 19:02:57.029 22839 22839 F DEBUG   : signal 11 (SIGSEGV), code 1 (SEGV_MAPERR), fault addr 0x7700000094
03-05 19:02:57.029 22839 22839 F DEBUG   :     x0  0000000000000000  x1  0000000000000003  x2  000000000000000a  x3  00000078b8ff0d0b
03-05 19:02:57.029 22839 22839 F DEBUG   :     x4  00000000000001bc  x5  00000078b8ff0d88  x6  0000000000000094  x7  0000000000000004
03-05 19:02:57.029 22839 22839 F DEBUG   :     x8  0000007700000000  x9  0000000000000094  x10 0000000000000004  x11 0000000000000000
03-05 19:02:57.029 22839 22839 F DEBUG   :     x12 0000000000000000  x13 0000000000000000  x14 0000000000000000  x15 0000000004000000
03-05 19:02:57.029 22839 22839 F DEBUG   :     x16 00000078b92fda60  x17 00000078b88d7c3c  x18 00000078b9089724  x19 00000078b933cc70
03-05 19:02:57.029 22839 22839 F DEBUG   :     x20 0000007892bb2c58  x21 00000078b931554c  x22 0000007892bb2c78  x23 00000078b933ccf0
03-05 19:02:57.029 22839 22839 F DEBUG   :     x24 00000078b933d038  x25 00000078b8feb848  x26 00000078b931554c  x27 00000078b933d728
03-05 19:02:57.029 22839 22839 F DEBUG   :     x28 0000000000000002  x29 00000079144d4d70
03-05 19:02:57.029 22839 22839 F DEBUG   :     lr  00000078b8554610  sp  00000079144d4d00  pc  00000078b8553628  pst 0000000080000000
03-05 19:02:57.385 22839 22839 F DEBUG   : backtrace:
03-05 19:02:57.385 22839 22839 F DEBUG   :       #00 pc 0000000000408628  /data/app/~~dLiM1_KRCe87axjg1Ub0lg==/org.ppsspp.ppsspp-g-njHp7blGRoP24x_Quemg==/lib/arm64/libppsspp_jni.so (IRInterpret(MIPSState*, IRInst const*, int)+1468) (BuildId: c548063a627049b8aa07ba364e42af7705e44050)
03-05 19:02:57.385 22839 22839 F DEBUG   :       #01 pc 000000000040b214  /data/app/~~dLiM1_KRCe87axjg1Ub0lg==/org.ppsspp.ppsspp-g-njHp7blGRoP24x_Quemg==/lib/arm64/libppsspp_jni.so (MIPSComp::IRJit::RunLoopUntil(unsigned long long)+168) (BuildId: c548063a627049b8aa07ba364e42af7705e44050)
03-05 19:02:57.385 22839 22839 F DEBUG   :       #02 pc 00000000005c9788  /data/app/~~dLiM1_KRCe87axjg1Ub0lg==/org.ppsspp.ppsspp-g-njHp7blGRoP24x_Quemg==/lib/arm64/libppsspp_jni.so (MIPSState::RunLoopUntil(unsigned long long)+300) (BuildId: c548063a627049b8aa07ba364e42af7705e44050)
03-05 19:02:57.385 22839 22839 F DEBUG   :       #03 pc 00000000005fc338  /data/app/~~dLiM1_KRCe87axjg1Ub0lg==/org.ppsspp.ppsspp-g-njHp7blGRoP24x_Quemg==/lib/arm64/libppsspp_jni.so (PSP_RunLoopWhileState()+104) (BuildId: c548063a627049b8aa07ba364e42af7705e44050)
03-05 19:02:57.385 22839 22839 F DEBUG   :       #04 pc 00000000007af7ac  /data/app/~~dLiM1_KRCe87axjg1Ub0lg==/org.ppsspp.ppsspp-g-njHp7blGRoP24x_Quemg==/lib/arm64/libppsspp_jni.so (EmuScreen::render()+288) (BuildId: c548063a627049b8aa07ba364e42af7705e44050)
03-05 19:02:57.386 22839 22839 F DEBUG   :       #05 pc 0000000000ca35d0  /data/app/~~dLiM1_KRCe87axjg1Ub0lg==/org.ppsspp.ppsspp-g-njHp7blGRoP24x_Quemg==/lib/arm64/libppsspp_jni.so (ScreenManager::render()+212) (BuildId: c548063a627049b8aa07ba364e42af7705e44050)
03-05 19:02:57.386 22839 22839 F DEBUG   :       #06 pc 00000000007a5db0  /data/app/~~dLiM1_KRCe87axjg1Ub0lg==/org.ppsspp.ppsspp-g-njHp7blGRoP24x_Quemg==/lib/arm64/libppsspp_jni.so (NativeRender(GraphicsContext*)+696) (BuildId: c548063a627049b8aa07ba364e42af7705e44050)
03-05 19:02:57.386 22839 22839 F DEBUG   :       #07 pc 000000000079e8ec  /data/app/~~dLiM1_KRCe87axjg1Ub0lg==/org.ppsspp.ppsspp-g-njHp7blGRoP24x_Quemg==/lib/arm64/libppsspp_jni.so (Java_org_ppsspp_ppsspp_NativeActivity_runVulkanRenderLoop+412) (BuildId: c548063a627049b8aa07ba364e42af7705e44050)
03-05 19:02:57.386 22839 22839 F DEBUG   :       #08 pc 0000000000009198  /data/app/~~dLiM1_KRCe87axjg1Ub0lg==/org.ppsspp.ppsspp-g-njHp7blGRoP24x_Quemg==/oat/arm64/base.odex (art_jni_trampoline+152)
03-05 19:02:57.386 22839 22839 F DEBUG   :       #09 pc 0000000000133564  /apex/com.android.art/lib64/libart.so (art_quick_invoke_stub+548) (BuildId: 4534ad9d35933bca04188bd2fdebf03e)
03-05 19:02:57.386 22839 22839 F DEBUG   :       #10 pc 0000000000197e94  /apex/com.android.art/lib64/libart.so (art::ArtMethod::Invoke(art::Thread*, unsigned int*, unsigned int, art::JValue*, char const*)+204) (BuildId: 4534ad9d35933bca04188bd2fdebf03e)
03-05 19:02:57.386 22839 22839 F DEBUG   :       #11 pc 00000000003037d4  /apex/com.android.art/lib64/libart.so (art::interpreter::ArtInterpreterToCompiledCodeBridge(art::Thread*, art::ArtMethod*, art::ShadowFrame*, unsigned short, art::JValue*)+376) (BuildId: 4534ad9d35933bca04188bd2fdebf03e)
03-05 19:02:57.386 22839 22839 F DEBUG   :       #12 pc 00000000002fe8ec  /apex/com.android.art/lib64/libart.so (bool art::interpreter::DoCall<false, false>(art::ArtMethod*, art::Thread*, art::ShadowFrame&, art::Instruction const*, unsigned short, art::JValue*)+884) (BuildId: 4534ad9d35933bca04188bd2fdebf03e)
03-05 19:02:57.386 22839 22839 F DEBUG   :       #13 pc 0000000000638924  /apex/com.android.art/lib64/libart.so (MterpInvokeVirtualQuick+708) (BuildId: 4534ad9d35933bca04188bd2fdebf03e)
03-05 19:02:57.386 22839 22839 F DEBUG   :       #14 pc 0000000000131594  /apex/com.android.art/lib64/libart.so (mterp_op_invoke_virtual_quick+20) (BuildId: 4534ad9d35933bca04188bd2fdebf03e)
03-05 19:02:57.386 22839 22839 F DEBUG   :       #15 pc 000000000010694c  /data/app/~~dLiM1_KRCe87axjg1Ub0lg==/org.ppsspp.ppsspp-g-njHp7blGRoP24x_Quemg==/oat/arm64/base.vdex (org.ppsspp.ppsspp.NativeActivity$1.run+68)
03-05 19:02:57.386 22839 22839 F DEBUG   :       #16 pc 00000000002f62c8  /apex/com.android.art/lib64/libart.so (art::interpreter::Execute(art::Thread*, art::CodeItemDataAccessor const&, art::ShadowFrame&, art::JValue, bool, bool) (.llvm.1401**************71)+268) (BuildId: 4534ad9d35933bca04188bd2fdebf03e)
03-05 19:02:57.386 22839 22839 F DEBUG   :       #17 pc 0000000000620cfc  /apex/com.android.art/lib64/libart.so (artQuickToInterpreterBridge+796) (BuildId: 4534ad9d35933bca04188bd2fdebf03e)
03-05 19:02:57.386 22839 22839 F DEBUG   :       #18 pc 000000000013cff8  /apex/com.android.art/lib64/libart.so (art_quick_to_interpreter_bridge+88) (BuildId: 4534ad9d35933bca04188bd2fdebf03e)
03-05 19:02:57.386 22839 22839 F DEBUG   :       #19 pc 000000000015ab68  /apex/com.android.art/javalib/arm64/boot.oat (java.lang.Thread.run+72) (BuildId: d789800e0f3df936987145e6aa2765c860ca6cc5)
03-05 19:02:57.387 22839 22839 F DEBUG   :       #20 pc 0000000000133564  /apex/com.android.art/lib64/libart.so (art_quick_invoke_stub+548) (BuildId: 4534ad9d35933bca04188bd2fdebf03e)
03-05 19:02:57.387 22839 22839 F DEBUG   :       #21 pc 0000000000197e94  /apex/com.android.art/lib64/libart.so (art::ArtMethod::Invoke(art::Thread*, unsigned int*, unsigned int, art::JValue*, char const*)+204) (BuildId: 4534ad9d35933bca04188bd2fdebf03e)
03-05 19:02:57.387 22839 22839 F DEBUG   :       #22 pc 000000000052990c  /apex/com.android.art/lib64/libart.so (art::(anonymous namespace)::InvokeWithArgArray(art::ScopedObjectAccessAlreadyRunnable const&, art::ArtMethod*, art::(anonymous namespace)::ArgArray*, art::JValue*, char const*)+104) (BuildId: 4534ad9d35933bca04188bd2fdebf03e)
03-05 19:02:57.387 22839 22839 F DEBUG   :       #23 pc 000000000052ab0c  /apex/com.android.art/lib64/libart.so (art::JValue art::InvokeVirtualOrInterfaceWithJValues<art::ArtMethod*>(art::ScopedObjectAccessAlreadyRunnable const&, _jobject*, art::ArtMethod*, jvalue const*)+440) (BuildId: 4534ad9d35933bca04188bd2fdebf03e)
03-05 19:02:57.387 22839 22839 F DEBUG   :       #24 pc 0000000000577b74  /apex/com.android.art/lib64/libart.so (art::Thread::CreateCallback(void*)+1272) (BuildId: 4534ad9d35933bca04188bd2fdebf03e)
03-05 19:02:57.387 22839 22839 F DEBUG   :       #25 pc 00000000000f4510  /apex/com.android.runtime/lib64/bionic/libc.so (__pthread_start(void*)+64) (BuildId: b1d7ec252d7b460a539cf3a520c06bb8)
03-05 19:02:57.387 22839 22839 F DEBUG   :       #26 pc 000000000008ef34  /apex/com.android.runtime/lib64/bionic/libc.so (__start_thread+64) (BuildId: b1d7ec252d7b460a539cf3a520c06bb8)
THEMETALLEGEND
commented
1 year ago
THEMETALLEGEND
commented
1 year ago if anyone wants a save state for right after this bug so they can play, let me know ill upload it :)
Hello. Can you please? :) [EDIT] Ok so I managed to bypass this error by disabling fast memory. But consider uploading it anyway in case it doesn't work for everybody.
vampy911
commented
1 year ago if anyone wants a save state for right after this bug so they can play, let me know ill upload it :)
Hello. Can you please? :) [EDIT] Ok so I managed to bypass this error by disabling fast memory. But consider uploading it anyway in case it doesn't work for everybody.
https://github.com/hrydgard/ppsspp/issues/14958#issuecomment-1293960585
 davidhedlund
commented
8 months ago
davidhedlund
commented
8 months ago I can confirm this.
Here is the save state file: PPSSPP_STATE.zip
davidhedlund
commented
8 months ago * Game ID: NPHG00092_1.00
Updates for https://report.ppsspp.org/games?name=ghost+of+sparta
Game or games this happens in
UCUS98737
What area of the game / PPSSPP
Crashing after pressing the L button to jump down
https://user-images.githubusercontent.com/37603562/135644948-ba1b43dd-5d44-43e5-aa14-16b65bce92e6.mp4
Fast Memory OFF Ignore Bad Memory Access try ON/OFF No cheats default graphics settings.
related to https://github.com/hrydgard/ppsspp/issues/10897 but that issue is about hw tessellation 🤔
What should happen
No crashing just (like using JIT or Interpreter with ignore bad memory access)
Logs
logcat_ppsspp.txt
Platform
Android
Mobile phone model or graphics card
Redmi Note 9 Android 11 Helio G85 Mali-G52 GPU
PPSSPP version affected
v1.11.3-1630
Last working version
No response
Graphics backend (3D API)
OpenGL / GLES
Checklist