 hughjonesd
commented
2 weeks ago
hughjonesd
commented
2 weeks ago I think you forgot shape = "ellipse".
Open brunomioto opened 2 weeks ago
hughjonesd
commented
2 weeks ago I think you forgot shape = "ellipse".
 brunomioto
commented
2 weeks ago
brunomioto
commented
2 weeks ago I think you forgot
shape = "ellipse".
Yes, I mean the plot area inside the inset plot
hughjonesd
commented
2 weeks ago So your device settings may be different. You may also want to use inset_theme().
I can't reproduce the example figure used in tutorial to plot an inset. I used the same code, just removed the shadow part.
Current figure:
Created on 2024-08-27 with reprex v2.0.2
Desired figure (from tutorial):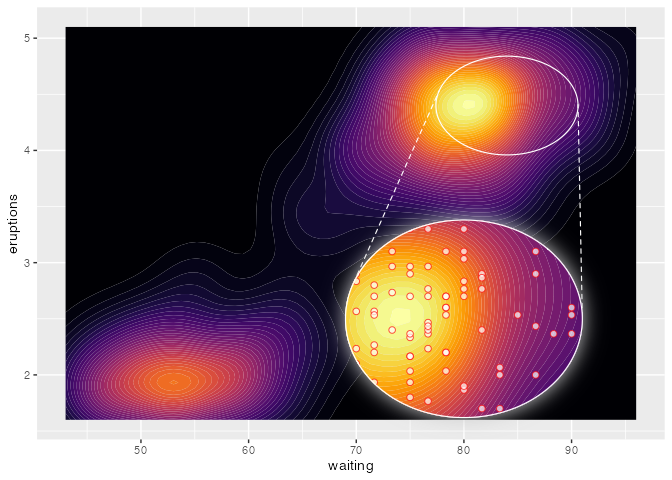
Created on 2024-08-27 with reprex v2.0.2