Open i-zro opened 4 years ago
X_b = np.c_[np.ones((100, 1)), X] # 모든 샘플에 x0 = 1을 추가합니다.
X_b
theta_best = np.linalg.inv(X_b.T.dot(X_b)).dot(X_b.T).dot(y)
theta_best
이거 왜 x가 0일 때 y가 4여서 theta_0이 4여야 best parameter인지 이해안가!
새로운 X 만들어주기
X_new = np.array([[0], [2]])
X_new
[[1,0],[1,2]] 행렬 만들어 주기
X_new_b = np.c_[np.ones((2, 1)), X_new] # 모든 샘플에 x0 = 1을 추가합니다.
X_new_b
theta_best로 학습 시키기
y_predict = X_new_b.dot(theta_best)
y_predict
예측 값으로 그래프 그리기
plt.plot(X_new, y_predict, "r-")
plt.plot(X, y, "b.")
plt.axis([0, 2, 0, 15])
plt.show()
from sklearn.linear_model import LinearRegression
lin_reg = LinearRegression()
lin_reg.fit(X, y)
lin_reg.intercept_, lin_reg.coef_ #편향(intercept), 가중치(coef)
lin_reg.predict(X_new)
행렬이 정사각행렬이 아닐 때 원래 계산은 SVD 기법으로 구함
# 싸이파이 lstsq() 함수를 사용하려면 scipy.linalg.lstsq(X_b, y)와 같이 씁니다.
theta_best_svd, residuals, rank, s = np.linalg.lstsq(X_b, y, rcond=1e-6)
theta_best_svd
np.linalg.pinv(X_b).dot(y)
eta = 0.1 # 학습률
n_iterations = 1000
m = 100
theta = np.random.randn(2,1) # 랜덤 초기화
for iteration in range(n_iterations):
gradients = 2/m * X_b.T.dot(X_b.dot(theta) - y)
theta = theta - eta * gradients
theta
X_new_b.dot(theta)
theta_path_bgd = []
def plot_gradient_descent(theta, eta, theta_path=None):
m = len(X_b)
plt.plot(X, y, "b.")
n_iterations = 1000
for iteration in range(n_iterations):
if iteration < 10:
y_predict = X_new_b.dot(theta)
style = "b-" if iteration > 0 else "r--"
plt.plot(X_new, y_predict, style)
gradients = 2/m * X_b.T.dot(X_b.dot(theta) - y)
theta = theta - eta * gradients
if theta_path is not None:
theta_path.append(theta)
plt.xlabel("$x_1$", fontsize=18)
plt.axis([0, 2, 0, 15])
plt.title(r"$\eta = {}$".format(eta), fontsize=16)
np.random.seed(42)
theta = np.random.randn(2,1) # random initialization
plt.figure(figsize=(10,4))
plt.subplot(1,3,1); plot_gradient_descent(theta, eta=0.02) #학습률이 너무 낮음. 최적점에 도달할 때 가지 시간 너무 많이 걸릴 것.
plt.ylabel("$y$", rotation=0, fontsize=18)
plt.subplot(1,3,2); plot_gradient_descent(theta, eta=0.1, theta_path=theta_path_bgd)
plt.subplot(1,3,3); plot_gradient_descent(theta, eta=0.5) #학습률이 너무 높음. 최적점에서 빠르게 멀어져 버림..
save_fig("gradient_descent_plot")
plt.show()
1) 배치 경사하강법의 단점 : 매 step에서 전체 training set를 써서, 시간이 너무 많이 든다는 거! 2) 확률적 경사 하강법 : 매 step에서 한 개의 Sample을 무작위로 선택하고, 그 sample에 대한 Gradient를 계산함 = 속도 빠름, 매우 큰 training set 에도 적용 가능
theta_path_sgd = []
m = len(X_b)
np.random.seed(42)
n_epochs = 50 # epoch : 학습의 횟수
t0, t1 = 5, 50 # 학습 스케줄 하이퍼파라미터
def learning_schedule(t):
return t0 / (t + t1)
theta = np.random.randn(2,1) # 랜덤 초기화
for epoch in range(n_epochs):
for i in range(m):
if epoch == 0 and i < 20:
y_predict = X_new_b.dot(theta) # 랜덤 초기화 한 값으로 예측 = 그래프 속 빨간색 선 성능 낮음!
style = "b-" if i > 0 else "r--"
plt.plot(X_new, y_predict, style)
random_index = np.random.randint(m) # np.random.randint() : 랜덤한 정수 return 해 줌
xi = X_b[random_index:random_index+1]
yi = y[random_index:random_index+1]
gradients = 2 * xi.T.dot(xi.dot(theta) - yi)
eta = learning_schedule(epoch * m + i) # 학습률은 점점 작게 줄어듦
theta = theta - eta * gradients
theta_path_sgd.append(theta)
plt.plot(X, y, "b.")
plt.xlabel("$x_1$", fontsize=18)
plt.ylabel("$y$", rotation=0, fontsize=18)
plt.axis([0, 2, 0, 15])
save_fig("sgd_plot")
plt.show()
theta
y.shape
from sklearn.linear_model import SGDRegressor
sgd_reg = SGDRegressor(max_iter=1000, tol=1e-3, penalty=None, eta0=0.1, random_state=42) # max_iter가 1000이므로, 최대 1000 에포크이고, tol = 1e-3 이므로, 한 에포크에서 1e-3보다 적게 손실이 줄어들 때까지 실행해야함
sgd_reg.fit(X, y.ravel()) #fit할 때 벡터형태로 들어가야함. np.ravel() : 1차원으로, 벡터형태로 바꿔줌
sgd_reg.intercept_, sgd_reg.coef_
theta_path_mgd = []
n_iterations = 50
minibatch_size = 20
np.random.seed(42)
theta = np.random.randn(2,1) # 랜덤 초기화
t0, t1 = 200, 1000
def learning_schedule(t):
return t0 / (t + t1)
t = 0
for epoch in range(n_iterations):
shuffled_indices = np.random.permutation(m) #랜덤으로 섞은 배열을 다시 반환
X_b_shuffled = X_b[shuffled_indices]
y_shuffled = y[shuffled_indices]
for i in range(0, m, minibatch_size):
t += 1
xi = X_b_shuffled[i:i+minibatch_size] #하나씩이 아니고 batch size만큼 받는 것
yi = y_shuffled[i:i+minibatch_size]
gradients = 2/minibatch_size * xi.T.dot(xi.dot(theta) - yi)
eta = learning_schedule(t)
theta = theta - eta * gradients
theta_path_mgd.append(theta)
theta
theta_path_bgd = np.array(theta_path_bgd)
theta_path_sgd = np.array(theta_path_sgd)
theta_path_mgd = np.array(theta_path_mgd)
plt.figure(figsize=(7,4))
plt.plot(theta_path_sgd[:, 0], theta_path_sgd[:, 1], "r-s", linewidth=1, label="Stochastic")
plt.plot(theta_path_mgd[:, 0], theta_path_mgd[:, 1], "g-+", linewidth=2, label="Mini-batch")
plt.plot(theta_path_bgd[:, 0], theta_path_bgd[:, 1], "b-o", linewidth=3, label="Batch")
plt.legend(loc="upper left", fontsize=16)
plt.xlabel(r"$\theta_0$", fontsize=20)
plt.ylabel(r"$\theta_1$ ", fontsize=20, rotation=0)
plt.axis([2.5, 4.5, 2.3, 3.9])
save_fig("gradient_descent_paths_plot")
plt.show()
정규 방정식을 이용한 선형 회귀
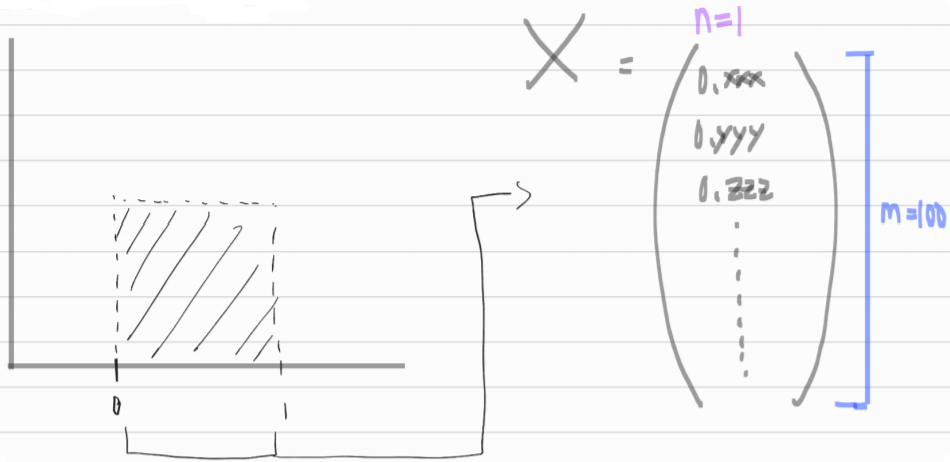
np.random.rand(100, 1)
np.random.randn(100, 1)