nus-se-bot
commented
3 years ago
nus-se-bot
commented
3 years ago Team's Response
We find that the animation is fast enough for most users, and the definition of 'quick' is arbitrary. It is subjective as to what considers as 'quick'. Moreover, increasing the speed will affect the smoothness of the animation, which will not be good for UI/UX.
Items for the Tester to Verify
:question: Issue response
Team chose [response.Rejected]
- [x] I disagree
Reason for disagreement: > We find that the animation is fast enough for most users, and the definition of ‘quick’ is arbitrary. It is subjective as to what considers as ‘quick’.
I fully agree that the definition of 'quick' is arbitrary. However, this was something I felt was annoying whenever I wanted to view the OCP after updating the list of deliverables frequently. Hence, the low severity given that this causes a minor inconvenience at most.
Moreover, increasing the speed will affect the smoothness of the animation, which will not be good for UI/UX.
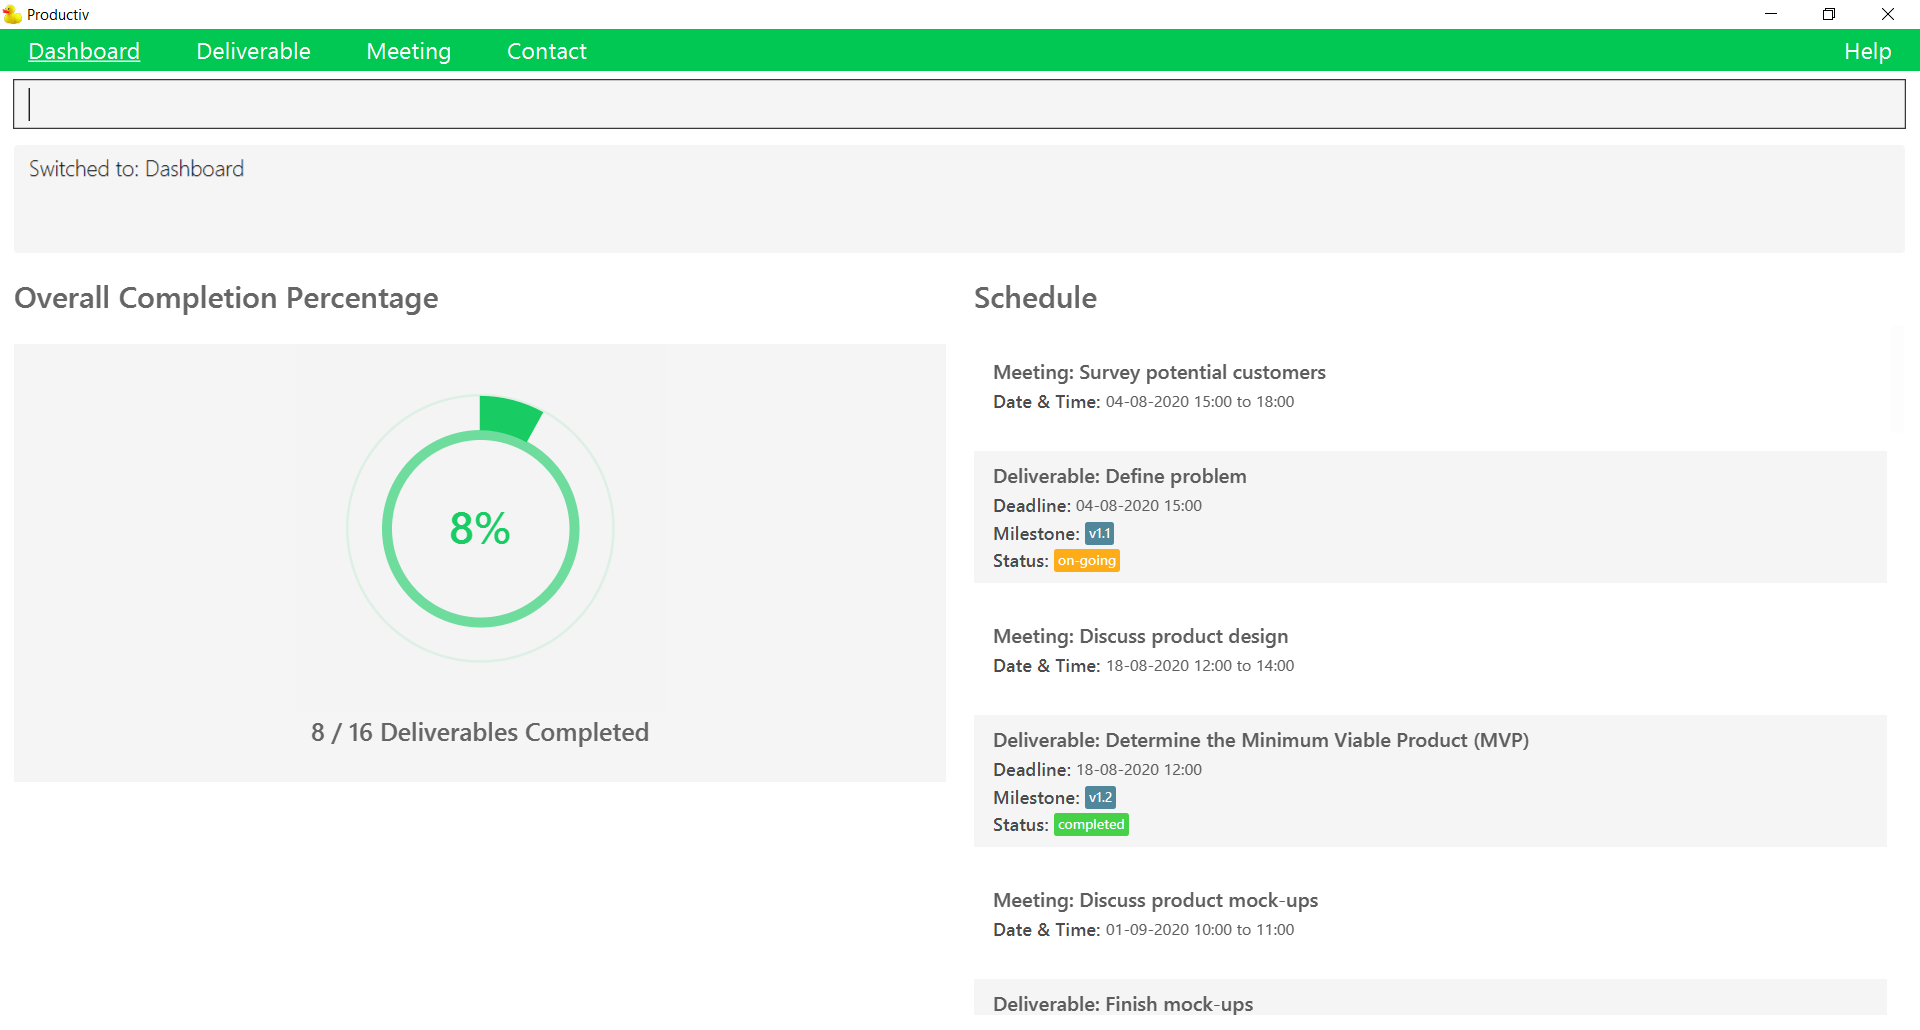
There is no need to increase the speed of the animation. I think the animation is very cool to see on initial load (good job on this :O). It only starts getting annoying once the user starts switching between modes often (simulating a real life product manager inputting deliverables and meetings and switching to the dashboard frequently) because the actual overall completion percentage (OCP) is not viewable without having to wait for a few seconds.
Perhaps the animation, upon switching to the dashboard tab, can start off from its previous state, rather than constantly resetting to 0%. For example, if the user's OCP is at 67% (6 out of 9 deliverables have been completed), and the user adds a new undone deliverable, then switches to the dashboard mode, the animation could start off at where it was previously (67%) before ending at the updated value (60%). This has the added benefit of drawing the user's attention to any changes in the OCP whenever the user switches to the dashboard mode.
Every time the dashboard mode is switched to, the user needs to wait for the overall completion percentage animation to finish playing before the actual percentage is viewable. In the worst case of all the deliverables being completed, this is a process that takes up to 3 seconds. This defeats the point of it being a "quick overview" as stated in the user guide.