 cxbrooks
commented
9 years ago
cxbrooks
commented
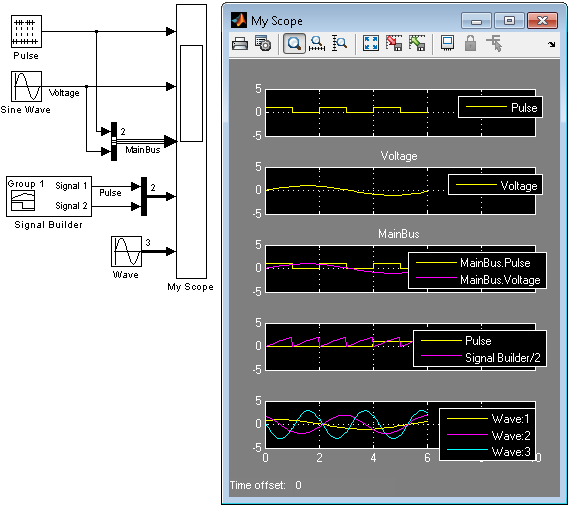
9 years ago Janett Cardoso proposed that the signal plotter be extended to allow multiple graphs to be displayed in one window. Each plot can then have its own Y values.
Matlab has a similar feature, see http://blogs.mathworks.com/images/seth/2012Q2/ScopeLegendDetails.png
Note: the issue was created automatically with bugzilla2github tool
Original bug ID: BZ#529 From: @cxbrooks Reported version: 9.1.devel CC: pt-dev@chess.eecs.berkeley.edu