imaNNeo / fl_chart

FL Chart is a highly customizable Flutter chart library that supports Line Chart, Bar Chart, Pie Chart, Scatter Chart, and Radar Chart.
https://flchart.dev
MIT License
6.77k stars 1.75k forks source link

FlTitlesData -> leftTitles shows static highest value with overlap on other titles #906

Open large opened 2 years ago

large commented 2 years ago

Describe the bug A picture says more than 1000-words image Titles are correct most of the time, like in the picture below image

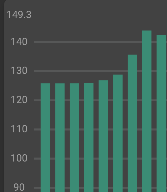
This static value was not showing in fl_chart v0.40.2 that I used before.

To Reproduce

//Textstyle
              TextStyle? verticalSideTitle = Theme.of(context)
                  .textTheme
                  .bodyText2
                  ?.copyWith(
                      fontSize: 10, color: currentTheme.verticalSideTitle);

//Barchart Init
BarChart(BarChartData(
//...
titlesData: FlTitlesData(
                        show: true,
                        leftTitles: SideTitles(
                          showTitles: true,
                          reservedSize: _reservedVertical,
                          getTextStyles: (context, value) => verticalSideTitle,
                          margin: 0,
                        ),
                        topTitles: SideTitles(showTitles: false),
                        rightTitles: SideTitles(showTitles: false),
                      ),
//...
));

Versions Flutter v2.10.1 fl_chart: 0.45.0

cirediew commented 2 years ago

I'm encountering the same issue. I think maxIncluded and minIncluded in AxisChartHelper.iterateThroughAxis should be parameterised to give us the option to include the max and min value on the axes.

Edit: In addition to this I'm seeing that some values are printed twice in the same place. This seems to be due to rounding errors. I ran the debugger and it happens at lastPosition and therefore lastPositionOverlapsWithMax is false because 0.05 and 0.05000000000000002 are not equal. I can make a different issue of this if requested.

Debugger screenshot

large commented 2 years ago

I haven't figured out where the bug are, but I got feedback from some users on it... Good test to try to pin point where, my flutter skills aren't there yet ;)

catteneo commented 2 years ago

Got same issue after updating from 0.41 to 0.45

244317809 commented 2 years ago

Same issue, test from 0.45, any workaround?

imaNNeo commented 2 years ago

Guys, you waited about 9 days. But you didn't provide a reproducible code (a robust main.dart) yet. It's so simple, I explained everywhere that if you provide a reproducible code, I can help you way faster.

cirediew commented 2 years ago

@imaNNeoFighT

Two examples:

Thank you in advance!

import 'package:fl_chart/fl_chart.dart';
import 'package:flutter/material.dart';

class TestPage extends StatelessWidget {
  const TestPage({Key? key}) : super(key: key);

  @override
  Widget build(BuildContext context) {
    return Scaffold(
      body: SafeArea(
        child: SingleChildScrollView(
          child: Column(
            children: [
              SizedBox(
                height: 300,
                child: Padding(
                  padding: const EdgeInsets.all(8.0),
                  child: BarChart(
                    BarChartData(
                      titlesData: FlTitlesData(
                          show: true,
                          topTitles: SideTitles(showTitles: false),
                          leftTitles: SideTitles(
                              showTitles: true,
                              textAlign: TextAlign.end,
                              getTextStyles: (context, _) =>
                                  const TextStyle(color: Colors.black54),
                              getTitles: (double value) =>
                                  value.toStringAsFixed(2),
                              interval: 0.01,
                              reservedSize: 50),
                          bottomTitles: SideTitles(
                            showTitles: true,
                            interval: 1,
                            getTitles: (index) {
                              return index.toString();
                            },
                          ),
                          rightTitles: SideTitles(showTitles: false)),
                      barGroups: [
                        BarChartGroupData(
                            x: 0, barRods: [BarChartRodData(y: -0.01)]),
                        BarChartGroupData(
                            x: 1, barRods: [BarChartRodData(y: 0.03)])
                      ],
                      minY: -0.1,
                      maxY: 0.05,
                    ),
                  ),
                ),
              ),
              SizedBox(
                height: 300,
                child: Padding(
                  padding: const EdgeInsets.all(8.0),
                  child: BarChart(
                    BarChartData(
                      titlesData: FlTitlesData(
                          show: true,
                          topTitles: SideTitles(showTitles: false),
                          leftTitles: SideTitles(
                              showTitles: true,
                              textAlign: TextAlign.end,
                              getTextStyles: (context, _) =>
                                  const TextStyle(color: Colors.black54),
                              getTitles: (double value) => value.toString(),
                              interval: 1,
                              reservedSize: 50),
                          bottomTitles: SideTitles(
                            showTitles: true,
                            interval: 1,
                            getTitles: (index) {
                              return index.toString();
                            },
                          ),
                          rightTitles: SideTitles(showTitles: false)),
                      barGroups: [
                        BarChartGroupData(
                            x: 0, barRods: [BarChartRodData(y: 10)]),
                        BarChartGroupData(
                            x: 1, barRods: [BarChartRodData(y: 21.5)])
                      ],
                      minY: 5,
                    ),
                  ),
                ),
              ),
            ],
          ),
        ),
      ),
    );
  }
}

Simulator Screen Shot - iPhone 13 - 2022-02-24 at 11 26 14

teunklijn commented 2 years ago

I'm facing the same issue, see an example main.dart below. Hope that helps.

To Reproduce

import 'package:fl_chart/fl_chart.dart';
import 'package:flutter/material.dart';

void main() {
  runApp(const MyApp());
}

class MyApp extends StatelessWidget {
  const MyApp({Key? key}) : super(key: key);

  @override
  Widget build(BuildContext context) {
    return MaterialApp(
      title: 'FL Chart Test',
      theme: ThemeData(
        primarySwatch: Colors.blue,
      ),
      home: const MyHomePage(),
    );
  }
}

class MyHomePage extends StatelessWidget {
  const MyHomePage({Key? key}) : super(key: key);

  @override
  Widget build(BuildContext context) {
    return Scaffold(
      appBar: AppBar(),
      body: Column(
        children: [
          const SizedBox(height: 32.0),
          SizedBox(
            height: 300,
            child: Padding(
              padding: const EdgeInsets.all(8.0),
              child: LineChart(
                LineChartData(
                  minX: 0,
                  maxX: 7,
                  titlesData: FlTitlesData(
                    rightTitles: SideTitles(
                      showTitles: true,
                      margin: 16.0,
                      reservedSize: 40,
                      // interval: 5,
                    ),
                    leftTitles: SideTitles(
                      showTitles: false,
                    ),
                    topTitles: SideTitles(
                      showTitles: false,
                    ),
                  ),
                  lineBarsData: [
                    LineChartBarData(
                      spots: const [
                        FlSpot(0, 11.5),
                        FlSpot(1, 15.5),
                        FlSpot(3, 20.1),
                        FlSpot(7, 19.1),
                      ],
                    ),
                  ],
                ),
              ),
            ),
          )
        ],
      ),
    );
  }
}

Versions

Flutter: v2.10.1 fl_chart: 0.45.0

Actual Result Simulator Screen Shot - iPhone 13 - 2022-03-01 at 15 42 54

imaNNeo commented 2 years ago

I'm facing the same issue, see an example main.dart below. Hope that helps.

To Reproduce

import 'package:fl_chart/fl_chart.dart';
import 'package:flutter/material.dart';

void main() {
  runApp(const MyApp());
}

class MyApp extends StatelessWidget {
  const MyApp({Key? key}) : super(key: key);

  @override
  Widget build(BuildContext context) {
    return MaterialApp(
      title: 'FL Chart Test',
      theme: ThemeData(
        primarySwatch: Colors.blue,
      ),
      home: const MyHomePage(),
    );
  }
}

class MyHomePage extends StatelessWidget {
  const MyHomePage({Key? key}) : super(key: key);

  @override
  Widget build(BuildContext context) {
    return Scaffold(
      appBar: AppBar(),
      body: Column(
        children: [
          const SizedBox(height: 32.0),
          SizedBox(
            height: 300,
            child: Padding(
              padding: const EdgeInsets.all(8.0),
              child: LineChart(
                LineChartData(
                  minX: 0,
                  maxX: 7,
                  titlesData: FlTitlesData(
                    rightTitles: SideTitles(
                      showTitles: true,
                      margin: 16.0,
                      reservedSize: 40,
                      // interval: 5,
                    ),
                    leftTitles: SideTitles(
                      showTitles: false,
                    ),
                    topTitles: SideTitles(
                      showTitles: false,
                    ),
                  ),
                  lineBarsData: [
                    LineChartBarData(
                      spots: const [
                        FlSpot(0, 11.5),
                        FlSpot(1, 15.5),
                        FlSpot(3, 20.1),
                        FlSpot(7, 19.1),
                      ],
                    ),
                  ],
                ),
              ),
            ),
          )
        ],
      ),
    );
  }
}

Versions

Flutter: v2.10.1 fl_chart: 0.45.0

Actual Result Simulator Screen Shot - iPhone 13 - 2022-03-01 at 15 42 54

Well, you can override the checkToShowTitle callback to hide the min or max value. Check below code:

rightTitles: SideTitles(
    showTitles: true,
    margin: 16.0,
    reservedSize: 40,
    checkToShowTitle: (
      double minValue,
      double maxValue,
      SideTitles sideTitles,
      double appliedInterval,
      double value,
    ) {
      if (value == maxValue || value == minValue) {
        return false;
      }
      return true;
    }
    // interval: 5,
),
teunklijn commented 2 years ago

Thanks, that helps. I would expect that it would respect the interval whenever set it though, instead of also showing the min and max value. Not a big problem of course, the workaround solves my problem.

imaNNeo commented 2 years ago

It's a little hard to detect texts overlapping. BTW we will try our best to do this under the hood. Thank you.

cirediew commented 2 years ago

@imaNNeoFighT I agree with @teunklijn. I don't think min and max should be forced

Like I mentioned above, adding maxIncluded and minIncluded parameters to SideTitles could be a good solution.

I think maxIncluded and minIncluded in AxisChartHelper.iterateThroughAxis should be parameterised to give us the option to include the max and min value on the axes.

Maybe defaulting them to true, but it will give us the option to exclude them if we want.

darioklapp commented 2 years ago

Just came across the same problem and found a quick workaround:

image

Maybe this helps somebody :)

cirediew commented 2 years ago

Yes, thank you @ColdSide1755, it is much easier to handle this in the new version. Great change @imaNNeoFighT!

GitHelge commented 2 years ago

As a workaround, I reverted back to 0.41.0 where the algorithm seems to be a bit different.

Dnathan33 commented 2 years ago

@imaNNeoFighT @ColdSide1755 in the workarounds you have provided if the max element aligns with the interval it will not be rendered. This is an undesired behavior. I think the change needs to be made in axis_chart_helper.dart and the max value should only be included if maxIncluded is true and lastPositionOverlapsWithMax is also true. Look at the function below.

Iterable<double> iterateThroughAxis({
    required double min,
    bool minIncluded = true,
    required double max,
    bool maxIncluded = true,
    required double baseLine,
    required double interval,
  }) sync* {
    final initialValue = Utils().getBestInitialIntervalValue(min, max, interval, baseline: baseLine);
    var axisSeek = initialValue;
    final firstPositionOverlapsWithMin = axisSeek == min;
    if (!minIncluded && firstPositionOverlapsWithMin) {
      axisSeek += interval;
    }
    final diff = max - min;
    final count = diff ~/ interval;
    final lastPosition = initialValue + (count * interval);
    final lastPositionOverlapsWithMax = lastPosition == max;
    final end = !maxIncluded && lastPositionOverlapsWithMax ? max - interval : max;

    final epsilon = interval / 100000;
    if (minIncluded && !firstPositionOverlapsWithMin) {
      yield min;
    }
    while (axisSeek <= end + epsilon) {
      yield axisSeek;
      axisSeek += interval;
    }
   // updated !lastPositionOverlapsWithMax to lastPositionOverlapsWithMax
    if (maxIncluded && lastPositionOverlapsWithMax) { 
      yield max;
    }
  }
SuricateTrading commented 2 years ago

Just came across the same problem and found a quick workaround:

image

Maybe this helps somebody :)

Thank you, this works. However, I think this should work automatically because it is very confusing for new users.

absar commented 2 years ago

Instead of always hiding the max title, you can conditionally hide it when it visually makes sense e.g. if last item is not from actual intervals and if the difference between second last interval and max is less than 50% of interval. This way last title will not be hidden unnecessarily

leftTitles: AxisTitles(
  sideTitles: SideTitles(
    showTitles: true,
    getTitlesWidget: (value, meta) {
      Widget axisTitle = Text(value.toString());
      // A workaround to hide the max value title as FLChart is overlapping it on top of previous
      if (value == meta.max) {
        final remainder = value % meta.appliedInterval;
        if (remainder != 0.0 && remainder / meta.appliedInterval < 0.5) {
          axisTitle = const SizedBox.shrink();
        }
      }
      return SideTitleWidget(axisSide: meta.axisSide, child: axisTitle);
    },
  ),
)
jesscmoore commented 1 year ago

Thank you @SuricateTrading and @absar - the modded solution worked nicely

bobatsar commented 11 months ago

My current workaround is to manually get the max and min values and calculate the next interval.

double roundNextInterval(double value, double interval) {
  if (value.isNegative) {
    return (value / interval).floor() * interval;
  } else {
    return (value / interval).ceil() * interval;
  }
}

Then I set the minY and maxY to these fixed valies in the LineChartData.

If this should be the default behavior or settable as an option, I could do a PR if somebody can tell me where this is currently calculated.

ShakilKhan999 commented 10 months ago

image

how can i fix this fl_chart: ^0.63.0 BarChart( BarChartData( maxY: maxValue + 5, minY: 0, barGroups: _chartGroups(dailyBarData), // titlesData: FlTitlesData(bottomTitles: AxisTitles(sideTitles: _bottomTitles)), borderData: FlBorderData(show: false), gridData: const FlGridData( show: true, drawHorizontalLine: true, drawVerticalLine: false), titlesData: FlTitlesData( bottomTitles: AxisTitles( sideTitles: _bottomTitles, ), topTitles: const AxisTitles( sideTitles: SideTitles(showTitles: false)), rightTitles: const AxisTitles( sideTitles: SideTitles(showTitles: false)), leftTitles: AxisTitles(sideTitles: SideTitles()),

              show: true,
            ),
            barTouchData: BarTouchData(
                handleBuiltInTouches: true,
                touchTooltipData:
                    BarTouchTooltipData(tooltipBgColor: Colors.white))),
      ),
artsooter commented 6 months ago

The essential reason for the problem is that the scale value with baseline as the initial value and interval as the step may be relatively close to the value of max or min. Because min or max is not within the numerical dimension with baseline as the initial value. (baseline defaults to 0)

I adjust the baseline to min. There will be no problem.

LineChartData( maxY: controller.getRangeY()['max'], minY: controller.getRangeY()['min'], baselineY: controller.getRangeY()['min'] ...)

riddhi-softprodigy commented 4 months ago

@imaNNeoFighT I agree with @teunklijn. I don't think min and max should be forced

Like I mentioned above, adding maxIncluded and minIncluded parameters to SideTitles could be a good solution.

I think maxIncluded and minIncluded in AxisChartHelper.iterateThroughAxis should be parameterised to give us the option to include the max and min value on the axes.

Maybe defaulting them to true, but it will give us the option to exclude them if we want.

imaNNeo commented 1 month ago

1686 is just landed in 0.69.0. Does it fix the issue?

enrique-lozano commented 5 days ago

I think this is a problem that has more to do with how the maximums and minimums are calculated in this library @imaNNeo . It has no sense that the last interval is smaller than the rest. It has to work like this (Excel screenshot):

image

The same data in fl_chart will return something like this or like other screenshots in this thread, which is a no-sense:

image