Open aaronadamsCA opened 2 years ago
Indeed, it's not necessarily that that rule is slow - it's that whichever rule is the first one to build up an ExportsMap of your entire codebase will be slow. Not every rule uses it.
However, named
does use the ExportsMap, so something strange must be going on with the namespace rule. I'd be happy to review a PR that improved its performance.
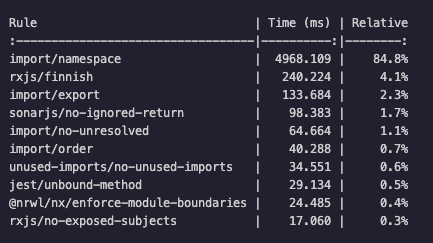
Same in our project. Seems to be really slow:
Rule | Time (ms) | Relative
:----------------------------------|----------:|--------:
import/namespace | 21149.982 | 62.4%
import/default | 2871.053 | 8.5%
import/no-named-as-default | 2305.758 | 6.8%
import/no-named-as-default-member | 1858.213 | 5.5%
rxjs/finnish | 1617.432 | 4.8%
import/order | 777.413 | 2.3%
import/no-unresolved | 519.802 | 1.5%
sonarjs/no-ignored-return | 391.950 | 1.2%
import/export | 387.884 | 1.1%
@nrwl/nx/enforce-module-boundaries | 324.435 | 1.0%
Rule | Time (ms) | Relative
:----|----------:|--------:
Rules:
"overrides": [
{
"files": ["*.ts", "*.tsx", "*.js", "*.jsx"],
"plugins": [
"unused-imports",
"rxjs-angular"
],
"settings": {
"import/parsers": {
"@typescript-eslint/parser": [".ts", ".tsx"]
},
"import/resolver": {
"typescript": {
"alwaysTryTypes": true,
"project": "./tsconfig.*?.json"
}
}
},
"extends": [
"plugin:@nrwl/nx/angular",
"plugin:unicorn/recommended",
"plugin:sonarjs/recommended",
"plugin:rxjs/recommended",
"plugin:import/recommended",
"plugin:import/typescript",
"plugin:storybook/recommended",
"plugin:@nrwl/nx/typescript"
],
"parserOptions": {
"project": ["tsconfig.*?.json"]
},
"rules": {
"import/newline-after-import": "error",
"import/no-unused-modules": "error",
"import/order": [
"error",
{
"alphabetize": {
"order": "asc",
"caseInsensitive": true
},
"newlines-between": "always",
"pathGroupsExcludedImportTypes": ["builtin"]
}
],
}
@the-ult Make sure to compare total time with vs. without the rule, so you can rule out the building of the export map as the cause. It would be good to have another solid data point here!
Another data point here:
without namespace:
Rule | Time (ms) | Relative
:------------------------------|----------:|--------:
prettier/prettier | 38484.339 | 43.1%
import/named | 13464.919 | 15.1%
react/no-deprecated | 4004.563 | 4.5%
react/no-direct-mutation-state | 3019.211 | 3.4%
import/no-restricted-paths | 2797.501 | 3.1%
import/extensions | 2255.116 | 2.5%
react/no-string-refs | 1929.564 | 2.2%
react/require-render-return | 1392.313 | 1.6%
react/display-name | 1247.210 | 1.4%
import/no-duplicates | 888.921 | 1.0%
with namespace:
import/namespace | 68662.137 | 47.8%
prettier/prettier | 37565.273 | 26.2%
react/no-deprecated | 3884.333 | 2.7%
react/no-direct-mutation-state | 2940.704 | 2.0%
import/no-restricted-paths | 2334.704 | 1.6%
react/no-string-refs | 1845.670 | 1.3%
import/extensions | 1786.525 | 1.2%
react/no-unstable-nested-components | 1482.991 | 1.0%
react/require-render-return | 1371.941 | 1.0%
import/named | 1118.946 | 0.8%
eslint-plugin-import@2.25.4, eslint@7.32.0, node@14.18.0
Throwing some timing blocks around the visitors, it spends ~40% of the time in Program and ~60% in MemberExpression.
I've pushed up b0e6f7f48945e2533e96d513248bf3e54e0c1aac but I don't expect it'll have a major impact on performance.
A somewhat informed guess: it looks like it's maybe cache missing on different relative paths to the same file: ex. ../../thing
vs ../thing
. I wonder if you could normalize those somehow with something like:
let importPath = declaration.source.value;
if (/\.+\//.test(importPath)) {
importPath = path.resolve(path.dirname(context.getPhysicalFilename()), importPath);
}
@epmatsw that does sound promising - if you wanted to try that locally (running the tests, and benchmarking it against your codebase) that would be very helpful :-) (even better, follow that up with a PR ;-) )
Seems like no dice, unfortunately. No apparent improvement from putting that snippet into Program :(
I'm getting similar results on an angular-eslint project:
Rule | Time (ms) | Relative
:----------------------------------------|----------:|--------:
import/namespace | 4511.714 | 97.9%
import/no-unresolved | 70.773 | 1.5%
import/no-duplicates | 12.654 | 0.3%
@angular-eslint/component-selector | 3.337 | 0.1%
import/export | 2.203 | 0.0%
import/no-named-as-default-member | 1.985 | 0.0%
@angular-eslint/no-conflicting-lifecycle | 1.429 | 0.0%
@angular-eslint/no-output-rename | 0.983 | 0.0%
import/default | 0.699 | 0.0%
@angular-eslint/contextual-lifecycle | 0.690 | 0.0%
As you can see, the top 3 rules are from this plugin.
@digeomel Please make sure to compare total run time with the rule enabled vs. disabled.
I think it's now pretty well established that the rule has an internal slowdown, but if you want to add your data point, you'll need to provide that comparison.
With import/order enabled in eslint.json
20sec
without: 13sec
For a simple (small library)
@the-ult theres a bunch of import rules in that diff, not just order.
yes @ljharb , you are right.
However. Disabling "import/namespace": "off",
specifically gives a major performance boost. With both other plugins enabled AND/OR disabled.
Tried disabling all other plugins / rules etc as well. But the difference would be like 1 sec per project.
Somehow, there seems to be something else going on as well (maybe NX related and gonna look into that), cause the lint is even much slower than the TIMING
seconds displayed.
[EDIT]
setting "import/extensions": [".ts"],
seems to help as well :
"settings": {
"import/extensions": [".ts"], // THIS GIVES A MAJOR PERFORMANCE BOOST
},
rules: {
"import/namespace": "error"
}
The import/extensions
setting always needs to be set, so it's a bug in your config if it's not.
With that fixed config, what's the speed difference (with a bunch of import rules enabled) between "import/namespace on" and "import/namespace off"? (the eslint text output, please; screenshots of text aren't accessible)
(Derailing a bit. We can take it elsewhere if that's best.)
The import/extensions setting always needs to be set, so it's a bug in your config if it's not.
In this case, the README could be clarified. Its current wording suggests it is optional, I believe:
You may set the following settings in your .eslintrc: This defaults to ['.js']
Would it make sense to say "Despite the default, it is recommended to explicitly set import/extensions
for your use-case."?
Yes, that'd be great. It especially must be set if you're using "not standard javascript", namely, TS.
The import/extensions setting always needs to be set, so it's a bug in your config if it's not.
This is/was indeed not very clear in the documentation.
Could/should it be part of the - plugin:import/typescript
??
Or be part of the documentation here?
With that fixed config, what's the speed difference (with a bunch of import rules enabled) between "import/namespace on" and "import/namespace off"? (the eslint text output, please; screenshots of text aren't accessible)
Tried to show it with the screenshots with the different build times.
But it seems like in some cases from 35sec
to 12sec
or even 1min
to 10sec
. So a major difference.
Will test/try it some more today
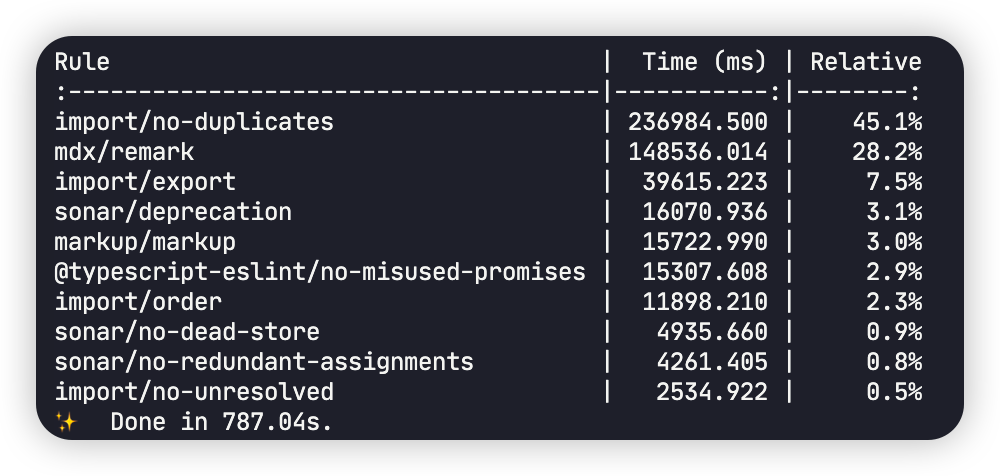
In my business case, import/no-duplicates
is very slow (I disabled import/namespace
for .ts
files).
See https://github.com/import-js/eslint-plugin-import/issues/2340#issuecomment-1002398962; whichever is the first rule to build the ExportMap will be the slowest.
I have another data point from my own codebase. Of note is that my 2nd slowest import/
rule (no-unused-modules
) saw a minor increase in time, but nowhere close to the time saved by excluding import/namespace
.
Total: 22,772 ms
Total: 16,133 ms
Seeing as apparently the first rule that builds the export map is always reported as the slowest, thus is misrepresenting time spent to the user, could this be seen as a bug in the reporting of the TIMING
feature? This way we can't really know where to look for the bottleneck in our linter setup.
Unfortunately since eslint doesn't provide any kind of "rule prep" stage, there's no way to separate out the export map timing from the rule timing.
Could I put a meaningless rule in front that catches this prep timing, so the rest still is valid by proportion?
hmm, maybe! I have no idea how eslint decides to order the rules.
What's probably easiest is to run timings; then disable the slowest rule and run them again, and in theory all but two should be roughly the same - and the one that's massively bigger in each run would be the one containing the export map buildup.
In our medium-sized mixed JS/TS codebase, specifically disabling
import/namespace
significantly reduced our lint times. I haven't found this mentioned by anyone else, so I wanted to share the finding, because it was very surprising.Our prior configuration ran like this:
I always assumed this was just the "first rule tax" while the export map is created, but adding
"import/namespace": "off"
did this for us:Given we already use
"import/no-namespace": "error"
, this rule wasn't doing anything for us anyway. With one line we've managed to significantly improve IDE responsiveness.