influxdata / telegraf

Agent for collecting, processing, aggregating, and writing metrics, logs, and other arbitrary data.
https://influxdata.com/telegraf
MIT License
14.66k stars 5.59k forks source link

high load average every 1h 45m #3465

Closed akaDJon closed 6 years ago

akaDJon commented 6 years ago

every 1h 45m load average my server up to 3-4 (normal 0.2-0.5) if stop telegraf service load average dont up every 1h 45m.

Why is this happening? Is it possible to adjust the time or period?

telegraf v1.4.3 influxdb v1.3.7

akaDJon commented 6 years ago

Would be useful to know if it matters what plugins are enabled, or if the load occurs with any plugin so long as there is enough traffic. I think the best way to check would be to enable only a single plugin and see if the issue still occurs, if it does, enable another single plugin and retest.

I checked it already, Load average have reducing load, but same interval. If collect very little data, then load average almost invisible
aldem commented 6 years ago

Would be useful to know if it matters what plugins are enabled, or if the load occurs with any plugin so long as there is enough traffic.

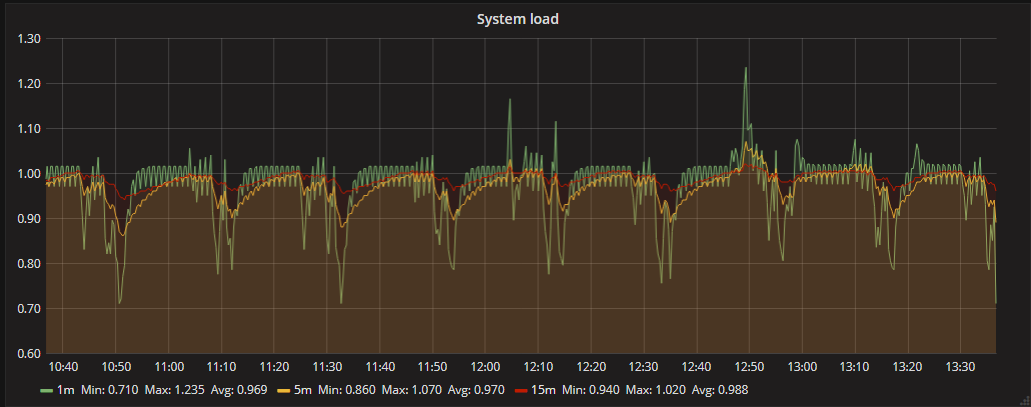
Well, with single plugin enabled (system, obviously), the situation is even "worse":

image

Now I have constant load of 1. I do not believe that querying for system load every 10 seconds could produce such load...

PS: After analyzing strace output, I am starting to suspect that all this behavior is not related to telegraf only - as it only uses futex/epoll/pselect/read/write call, and not so often. Most likely, this is related to how Linux computes load average based on process states, and several sleeping threads (depending on state and method) may cause such strange behavior (especially when user-space is involved - a case of futex).

apooniajjn commented 6 years ago

I am seeing the same behavior on my host where telegraf agent is being installed and it's happening every 7 hours. CPU load increases and triggers an alert (which I am also using zabbix to monitor this host) .. Hosts where I have installed telegraf agents are showing the same behavior...Updating collection_jitter = "3s" didn't solve this issue as well.

danielnelson commented 6 years ago

@apooniajjn When this issue occurs there does not seem to be a cpu increase, only load average. Please ask over at the InfluxData Community site and I'll help you there.

apooniajjn commented 6 years ago

@danielnelson thanks .. yeah my bad I meant system load ... let me reach out to you there

danielnelson commented 6 years ago

@apooniajjn If it matches this issue closely other than the period, then you can just use this issue. At this time it is unknown what might be causing the problem.

apooniajjn commented 6 years ago

@danielnelson yeah it matches closely to this issue except the period ...

ekeih commented 6 years ago

I just want to point out that 7hours = 4 * 1h45m 😉

danielnelson commented 6 years ago

https://youtu.be/J9Y9GsPtbmQ

8h2a commented 6 years ago

I have the same issue but with collectd (and rrdcached as backend) (on Debian Stretch) instead of Telegraf: collectd

When searching the internet for load every 105 minutes you can find more instances of this problem that are unrelated to Telegraf.

gentstr commented 6 years ago

Here's a good article talking about how this is calculated in the linux kernel and why it happens. https://blog.avast.com/investigation-of-regular-high-load-on-unused-machines-every-7-hours

Zbychad commented 6 years ago

Very useful article, thanks for sharing. Based on that, we've changed "collection_jitter" from 0 to 5s. Here's the result: image

danielnelson commented 6 years ago

@gentstr I think that pretty much explains it, thanks for the link. Though I do wonder why in our case the interference occurs so frequently, and not every 14 hours since most users probably have a 10s interval.

I'm going to close this issue since there isn't an action to take on our part, anyone who wants to reduce this artifact can use collection_jitter.

dynek commented 5 years ago

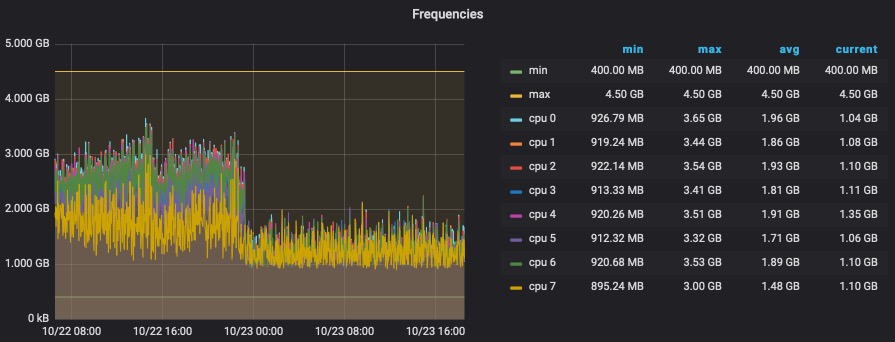
Was experimenting same behaviour and really liked the article explaining the artefact. Ended up using collection and flush jitter and it went beyond what I was expecting. It is even lowering the CPU frequencies (using powersave governor): 2019-10-23 at 18 32

Note that this machine (Intel NUC) is running a couple virtual machines each with telegraf installed.

alpiua commented 3 years ago

Faced the same issue with high LA every 6h 54 minutes. All systems except one were cured with setting jitter in telegraf config. The only one host left had the problem with the other software (vector pipeline building too had an issue with the file buffers). Fixed that as well. Thanks for the article above.

Will add this to the collection: https://www.brendangregg.com/blog/2017-08-08/linux-load-averages.html