ipfs / kubo

An IPFS implementation in Go
https://docs.ipfs.tech/how-to/command-line-quick-start/
Other
15.83k stars 2.96k forks source link

Too many open files (regression?) #6237

Closed koalalorenzo closed 4 years ago

koalalorenzo commented 5 years ago

Version information:

go-ipfs version: 0.4.20-
Repo version: 7
System version: amd64/linux
Golang version: go1.12.4

Type: Bug(?)

maybe bug, maybe misconfiguration after upgrading

Description:

I have been meeting this issue on a set of different machines of different types with different networks and different configurations. All the nodes are providing a public writable gateway. ( https://siderus.io/ ) All of them reported this:

Apr 19 02:33:06 usa-valley2 ipfs[3329]: 02:33:06.470 ERROR     flatfs: too many open files, retrying in 100ms flatfs.go:385
Apr 19 07:22:40 apac-tokyo1 ipfs[533]: 2019/04/19 07:22:40 http: Accept error: accept tcp4 127.0.0.1:8080: accept4: too many open files; retrying in 5ms
Apr 19 09:25:33 eu-stockholm1 ipfs[15101]: 2019/04/19 09:25:33 http: Accept error: accept tcp4 127.0.0.1:8080: accept4: too many open files; retrying in 320ms
Apr 19 09:25:33 eu-stockholm1 ipfs[15101]: 09:25:33.959 ERROR     flatfs: too many open files, retrying in 100ms flatfs.go:385

I found this issue after upgrading. The upgrade was executed automatically (no human touch) and all of the machines are similar with the exception of network, cpu and memory that is different based on the average traffic. Since this version we stopped using docker and started using our own Debian packages but previous tests were successful (12 hours of usage of a/b testing). The issue appeared recently and it seems that it might be caused by a set of requests from the users combined with a misconfiguration (ulimit?)

Maybe related #4102 #3792 (?)

Is this a bug or should I change the limits? How can I ensure that IPFS respects that limit?

Stebalien commented 5 years ago

Could you cat /proc/$(pidof ipfs)/limits and the output of ipfs swarm peers | wc -l? Go-ipfs automatically raises it's limits put probably not enough to be run as a public gateway directly, assuming that's what you're doing.

Note: You may also want to consider sticking an nginx reverse proxy out in front. That should reduce the number of inbound connections.
koalalorenzo commented 5 years ago

Note: You may also want to consider sticking an nginx reverse proxy out in front. That should reduce the number of inbound connections.
sorry for my words. There is a reverse proxy and a Layer 7 load balancer in front of that for HTTP. I would never leave something unstable like go-ipfs without a HA setup.

The highwater and lowwater previously were increased (with Docker and 0.4.19), since I moved to 0.4.20 I have used default values but enabling the writable gateway and changing the GC and StorageMax

Both of these nodes are slow or not responsive (but coming back after a while). Another node needed a forced restart as IPFS made it unresponsive, so I was not able to get the data.

Peer eu-stockholm1

Could you cat /proc/$(pidof ipfs)/limits

Limit                     Soft Limit           Hard Limit           Units
Max cpu time              unlimited            unlimited            seconds
Max file size             unlimited            unlimited            bytes
Max data size             unlimited            unlimited            bytes
Max stack size            8388608              unlimited            bytes
Max core file size        0                    unlimited            bytes
Max resident set          unlimited            unlimited            bytes
Max processes             7664                 7664                 processes
Max open files            2048                 2048                 files
Max locked memory         16777216             16777216             bytes
Max address space         unlimited            unlimited            bytes
Max file locks            unlimited            unlimited            locks
Max pending signals       7664                 7664                 signals
Max msgqueue size         819200               819200               bytes
Max nice priority         0                    0
Max realtime priority     0                    0
Max realtime timeout      unlimited            unlimited            us

The output of ipfs swarm peers | wc -l?

2410 peers

Peer apac-tokyo1

Could you cat /proc/$(pidof ipfs)/limits

Limit                     Soft Limit           Hard Limit           Units
Max cpu time              unlimited            unlimited            seconds
Max file size             unlimited            unlimited            bytes
Max data size             unlimited            unlimited            bytes
Max stack size            8388608              unlimited            bytes
Max core file size        0                    unlimited            bytes
Max resident set          unlimited            unlimited            bytes
Max processes             3700                 3700                 processes
Max open files            2048                 2048                 files
Max locked memory         16777216             16777216             bytes
Max address space         unlimited            unlimited            bytes
Max file locks            unlimited            unlimited            locks
Max pending signals       3700                 3700                 signals
Max msgqueue size         819200               819200               bytes
Max nice priority         0                    0
Max realtime priority     0                    0
Max realtime timeout      unlimited            unlimited            us

The output of ipfs swarm peers | wc -l?

698 peers

Stebalien commented 5 years ago

eu-stockholm1 definitely has too many peers (although some of those are obviously using non-fd-consuming transports).

~I have had reports that leveldb is consuming a bunch of file descriptors and this could be due to our new on-disk provider queue (which is using leveldb).~ edit: this is really unlikely

obo20 commented 5 years ago

@Stebalien I'm also running into this issue as well as of 0.4.20. We had roughly 800 peers connected to the node when I encountered the issue with the following limits:

Max cpu time              unlimited            unlimited            seconds   
Max file size             unlimited            unlimited            bytes     
Max data size             unlimited            unlimited            bytes     
Max stack size            8388608              unlimited            bytes     
Max core file size        0                    unlimited            bytes     
Max resident set          unlimited            unlimited            bytes     
Max processes             64115                64115                processes 
Max open files            2048                 2048                 files     
Max locked memory         65536                65536                bytes     
Max address space         unlimited            unlimited            bytes     
Max file locks            unlimited            unlimited            locks     
Max pending signals       64115                64115                signals   
Max msgqueue size         819200               819200               bytes     
Max nice priority         0                    0                    
Max realtime priority     0                    0                    
Max realtime timeout      unlimited            unlimited            us  

It's probably worth noting that I have never encountered this problem before 0.4.20 (although this could be entirely coincidental, as I saw quite a few bug reports of this already exist on earlier versions). However it does make me wonder if the updates you mentioned in the relay section of the 0.4.20 release notes had anything to do with this:

  • We've significantly reduced the amount of memory allocated per-peer.
  • We've fixed a bug where relays might, in rare cases, try to actively dial a peer to relay traffic. By default, relays only forward traffic between peers already connected to the relay.
  • We've fixed quite a number of performance issues that only show up when rapidly forming new connections. This will actually help all nodes but will especially help relays.
Stebalien commented 5 years ago

The next time someone runs into this, please run sudo lsof -n -P -p $(pidof ipfs).

koalalorenzo commented 5 years ago

Still running into this daily, so I can help as much as I can :)

Et voila: https://siderus.io/ipfs/QmeHWnYK5VpQvfFWV4wPgujB3PwAnNS5TR8iUWfDkghqnd

(Those are other nodes affected, if you want the same as the previous let me know)

hsanjuan commented 5 years ago

I'm also observing this errors, particularly on accepting new connections. I think this causes the affected listeners to shutdown.

https://ipfs.io/ipfs/QmX4A8DzvxeR1uC7xoTCTQPbynsHAD64gdsSCm1VPc8brC

I am going to try to run with a much larger FD limit and see if it hits it too.

Stebalien commented 5 years ago

@koalalorenzo what are your connection manager limits?

Both of you, does downgrading help?

koalalorenzo commented 5 years ago

My connection manager config is the default one (Never touched since I generated the conf file)

"ConnMgr": {
      "Type": "basic",
      "LowWater": 600,
      "HighWater": 900,
      "GracePeriod": "20s"
}

I know that @obo20 downgraded to fix the issue. I will downgrade a percentage of the machines so that I can help debug this, in case. Let me know what I can do to help!

hsanjuan commented 5 years ago

FD Limit was 4096 before. I set a new limit at 16k. Right now after 24h or so we have:

ready (5)> lsof -n -P -p $(pidof ipfs) | wc -l
cluster2.fsn.dwebops.pub : 5781
cluster3.fsn.dwebops.pub : 5326
cluster4.fsn.dwebops.pub : 5837
cluster1.fsn.dwebops.pub : 6053
cluster0.fsn.dwebops.pub : 6471

I will report back to see if the figure increases in the next hours. The connManager is at:

    "ConnMgr": {
      "Type": "basic",
      "LowWater": 1500,
      "HighWater": 2000,
      "GracePeriod": "1m"
    }
obo20 commented 5 years ago

@hsanjuan Can you provide the specs of the machines that you're using?

I'd also be curious to know how many "root" objects you have on those machines.

hsanjuan commented 5 years ago

@obo20 12cores, 64GB RAM, root objects ranging from 3000 to 6000.

koalalorenzo commented 5 years ago

@obo20 12cores, 64GB RAM, root objects ranging from 3000 to 6000.

@hsanjuan Have you tried on smaller machines? something like 2 cores, 2/4GB RAM? More into the "consumer/desktop/notebooks" set of machine size?

obo20 commented 5 years ago

@hsanjuan Have you tried on smaller machines? something like 2 cores, 2/4GB RAM? More into the "consumer/desktop/notebooks" set of machine size?

I'd like to know this as well. While resources are always important, I'm curious to know how much of a role they play here. From inspecting my nodes after they hit this issue, they haven't seemed maxed out from a resource standpoint at all.

sanderpick commented 5 years ago

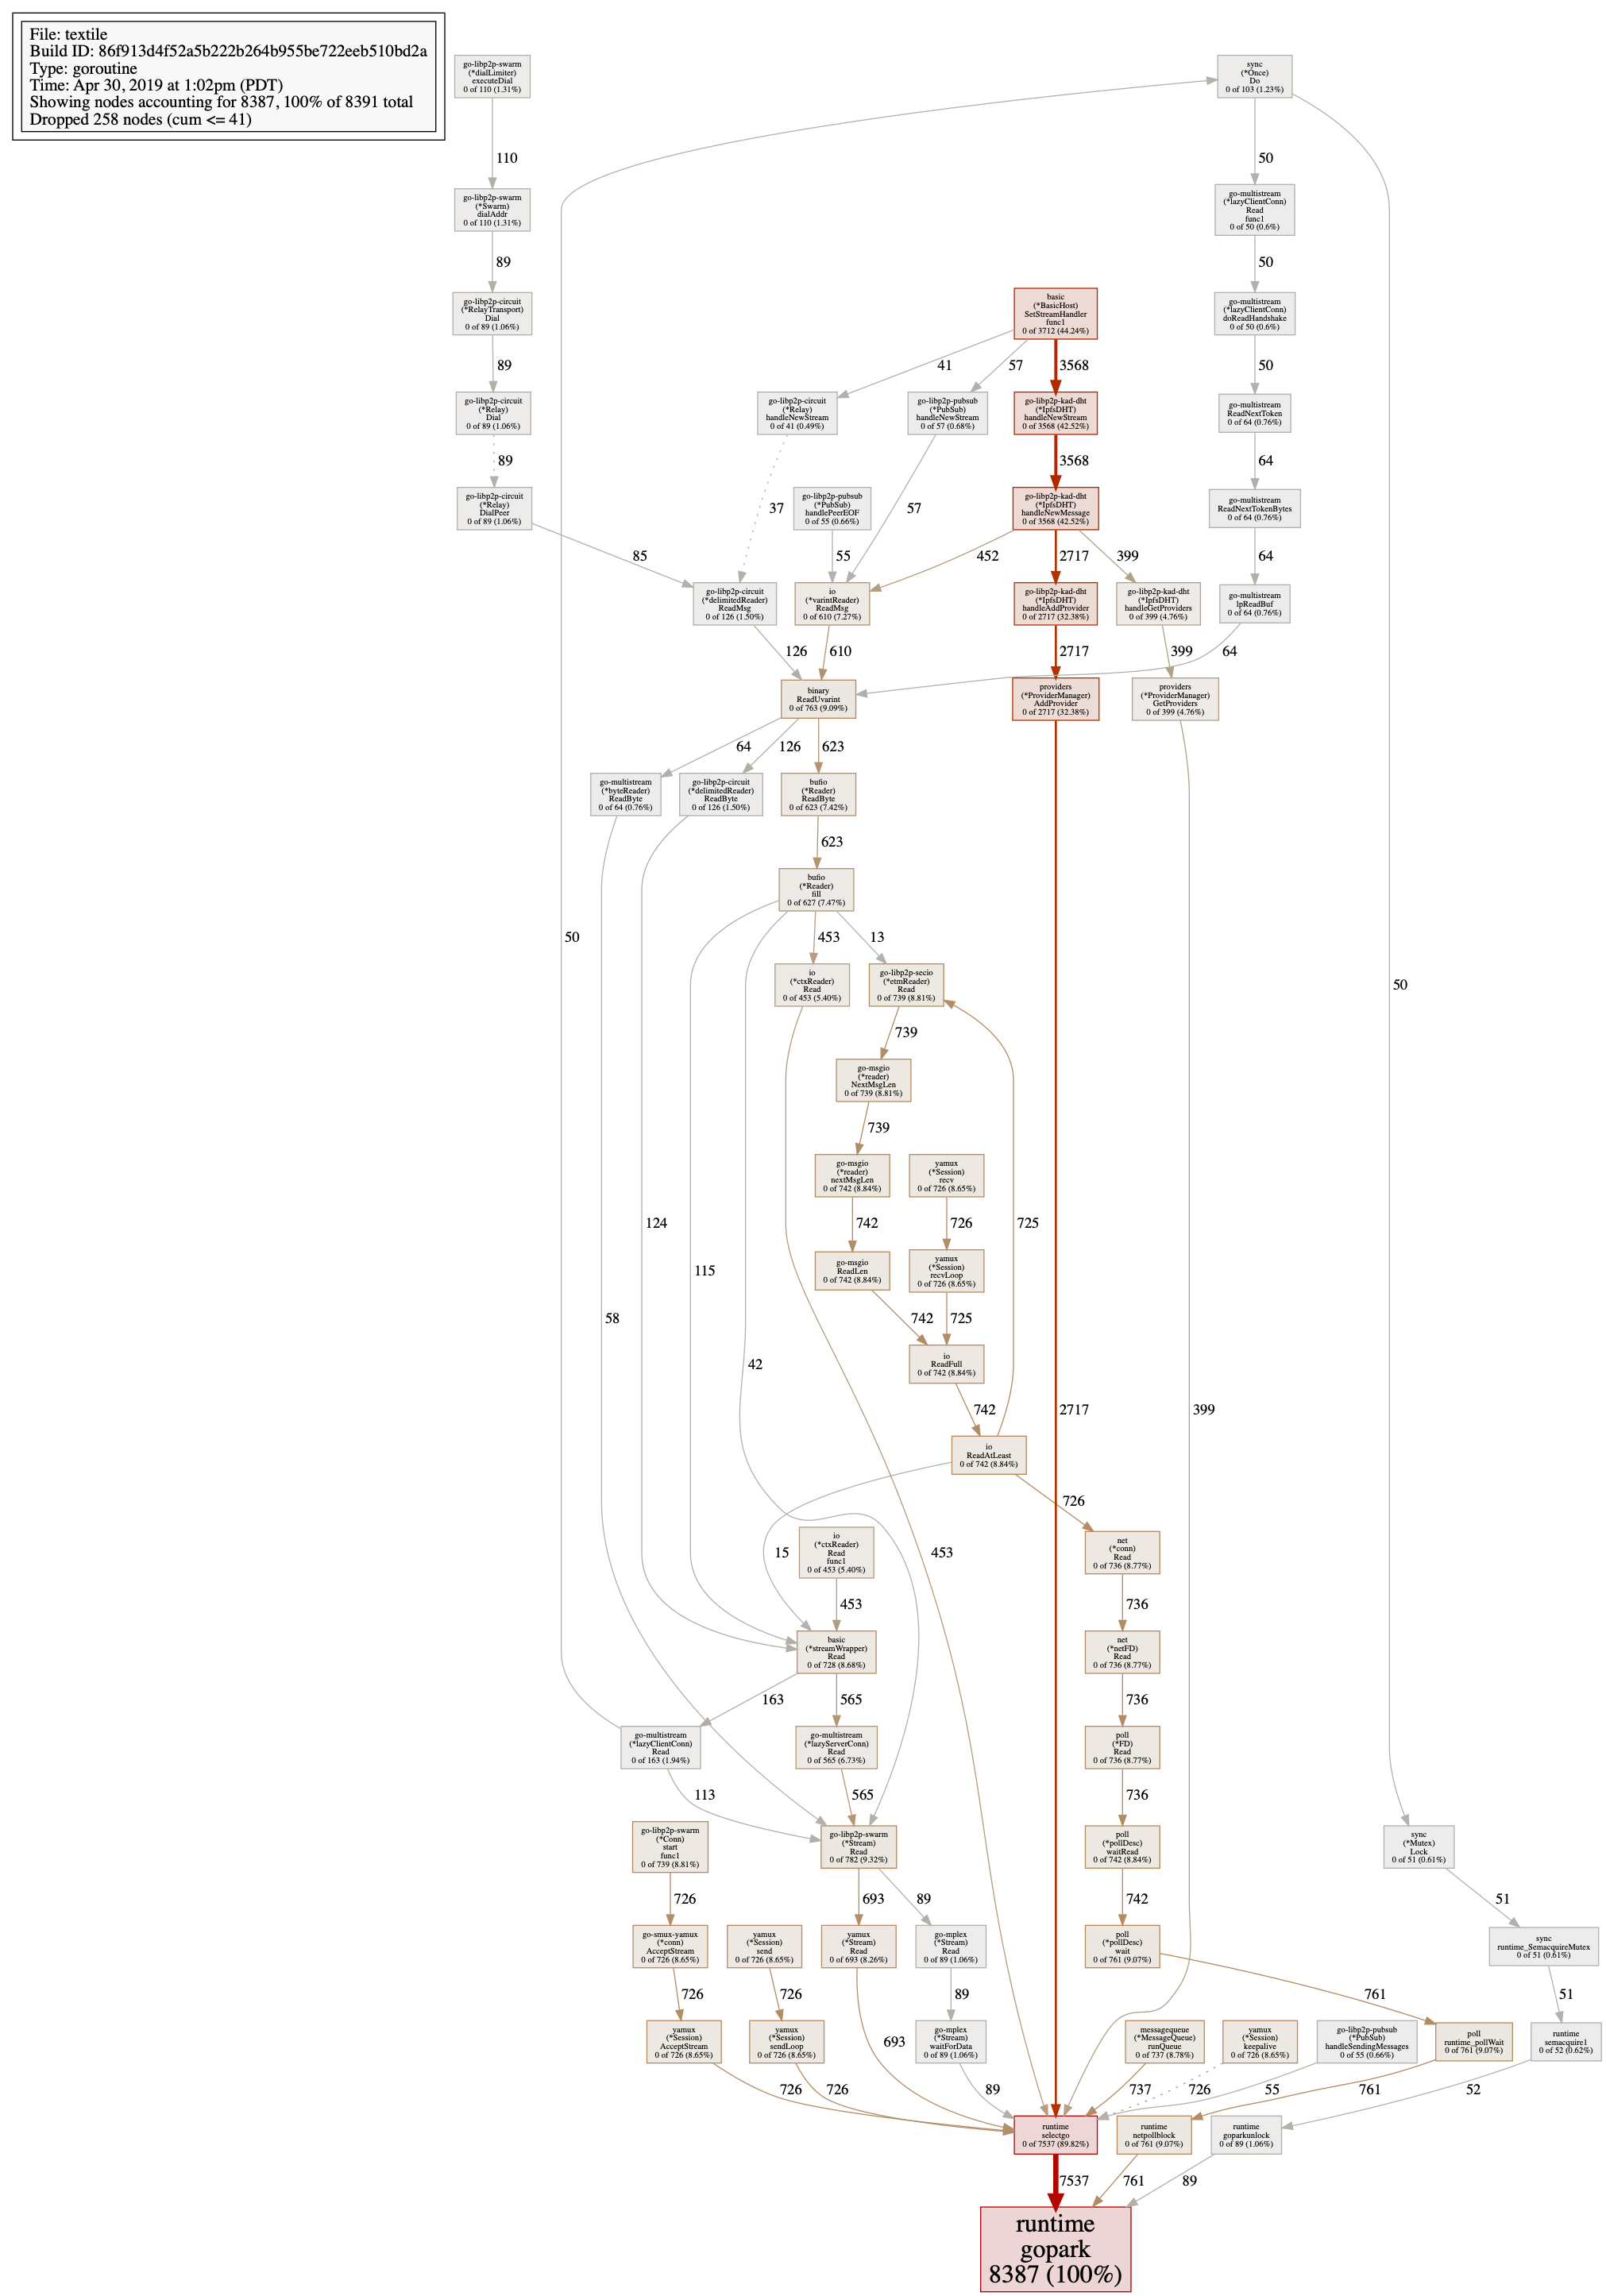
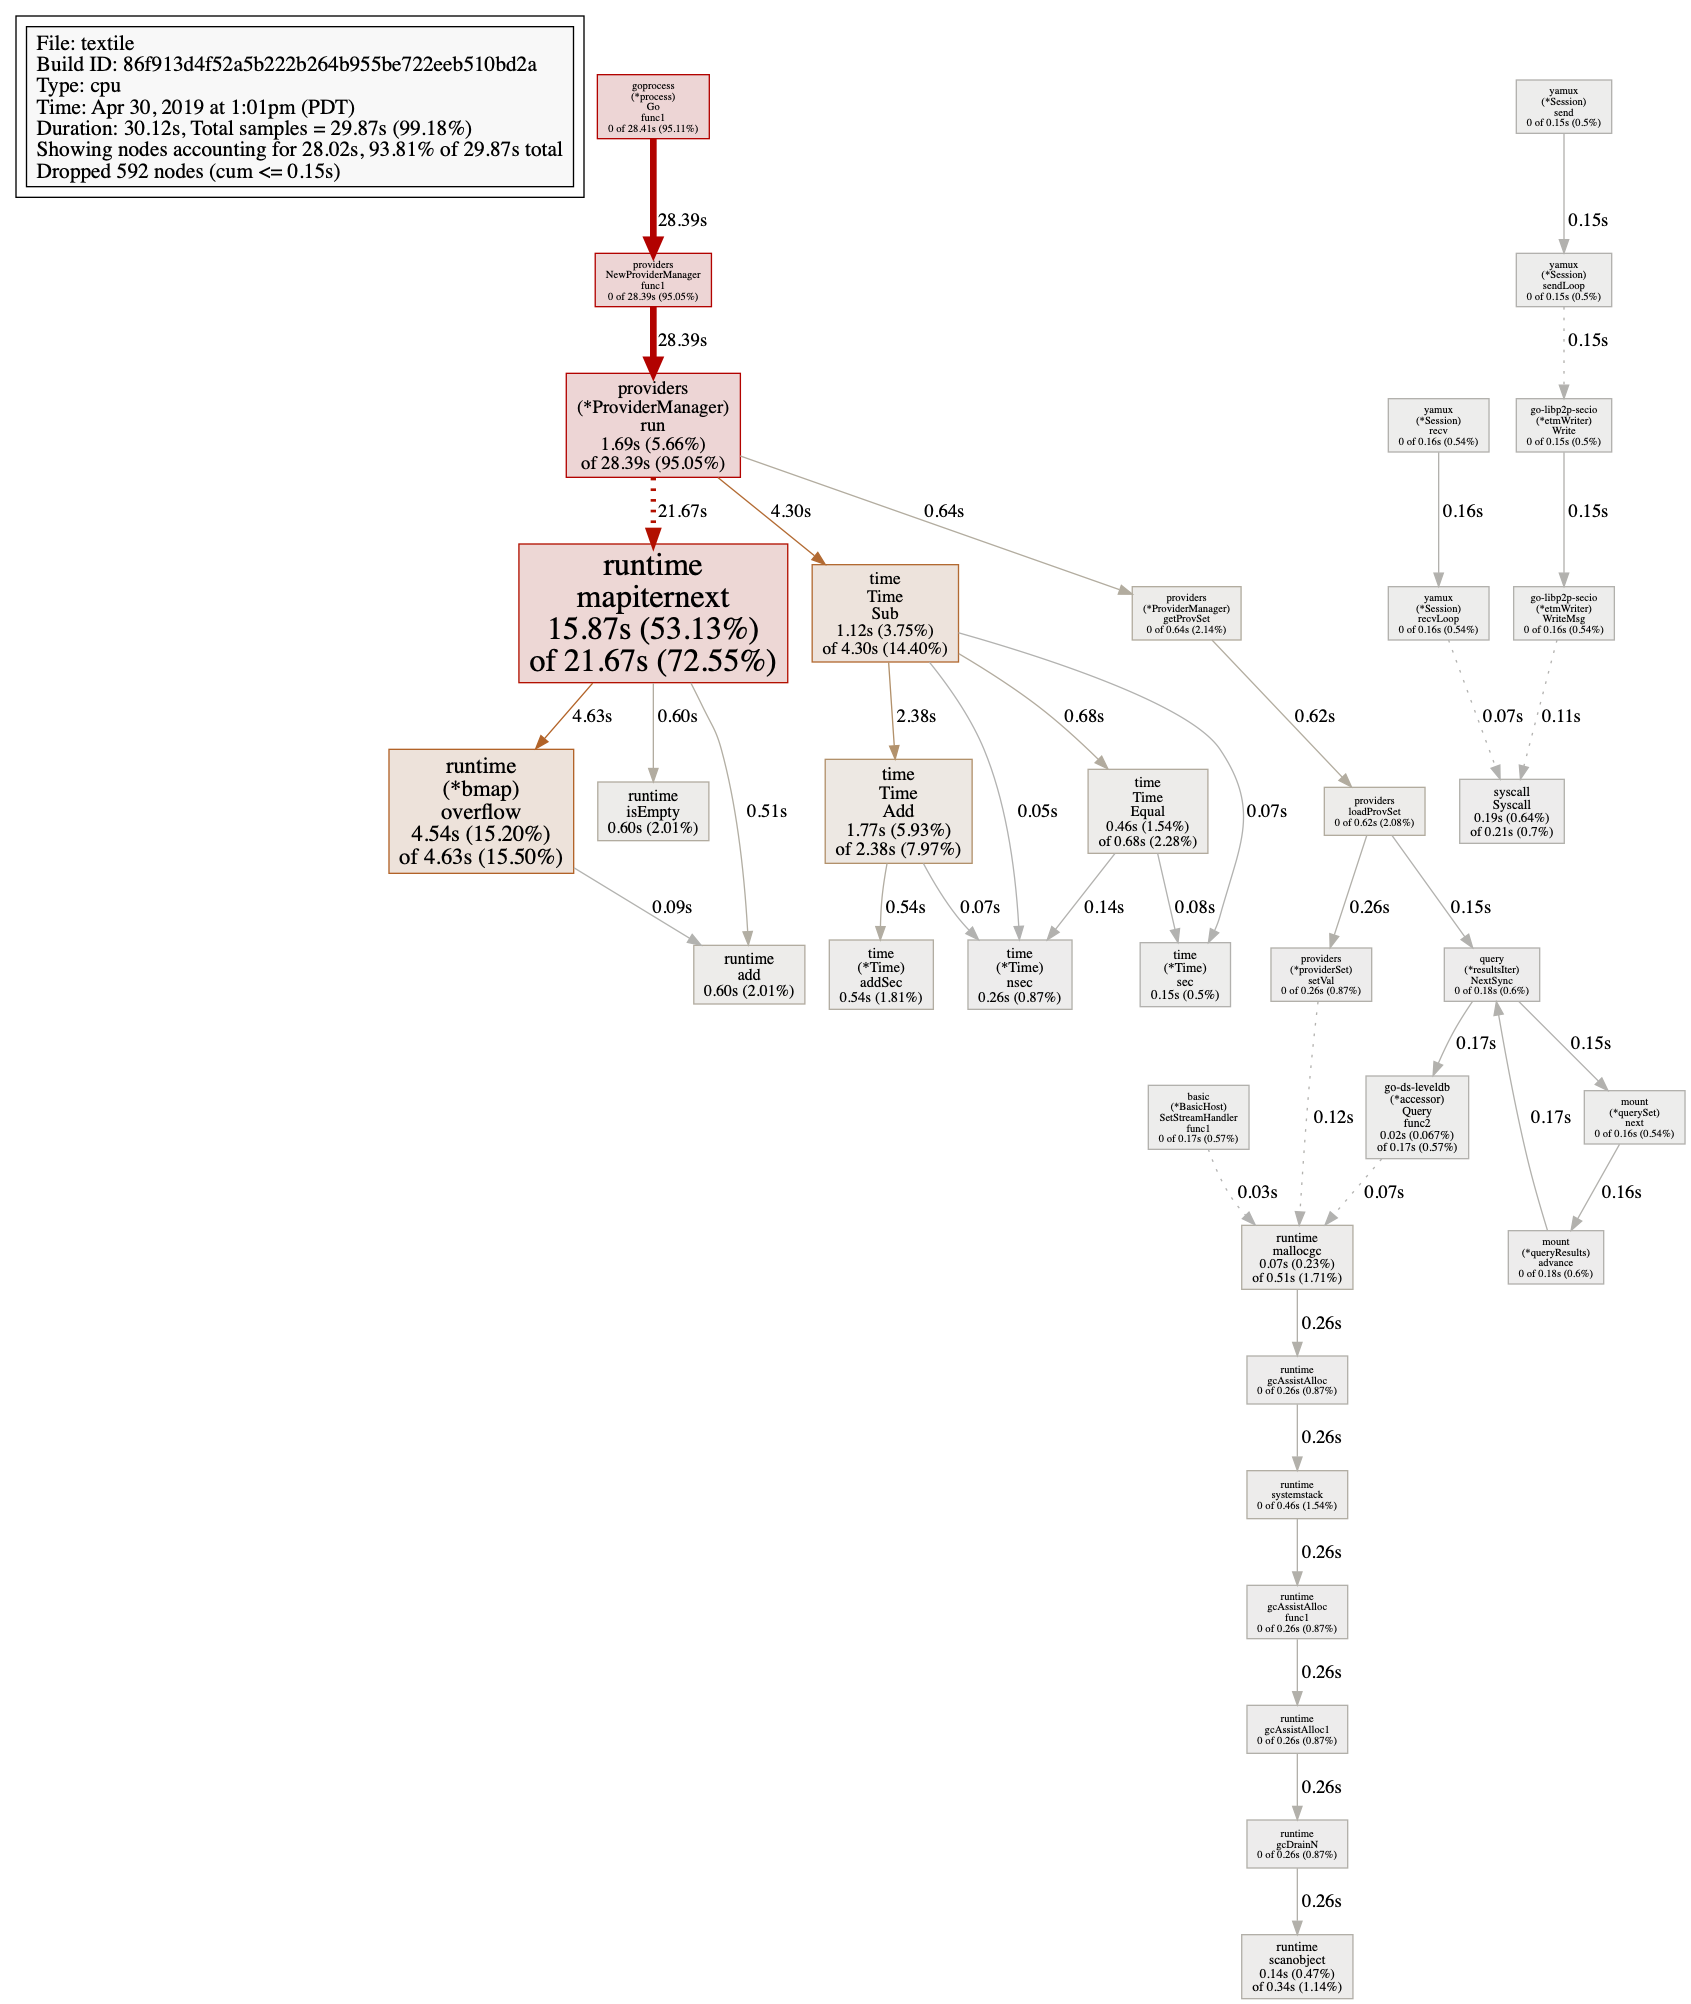
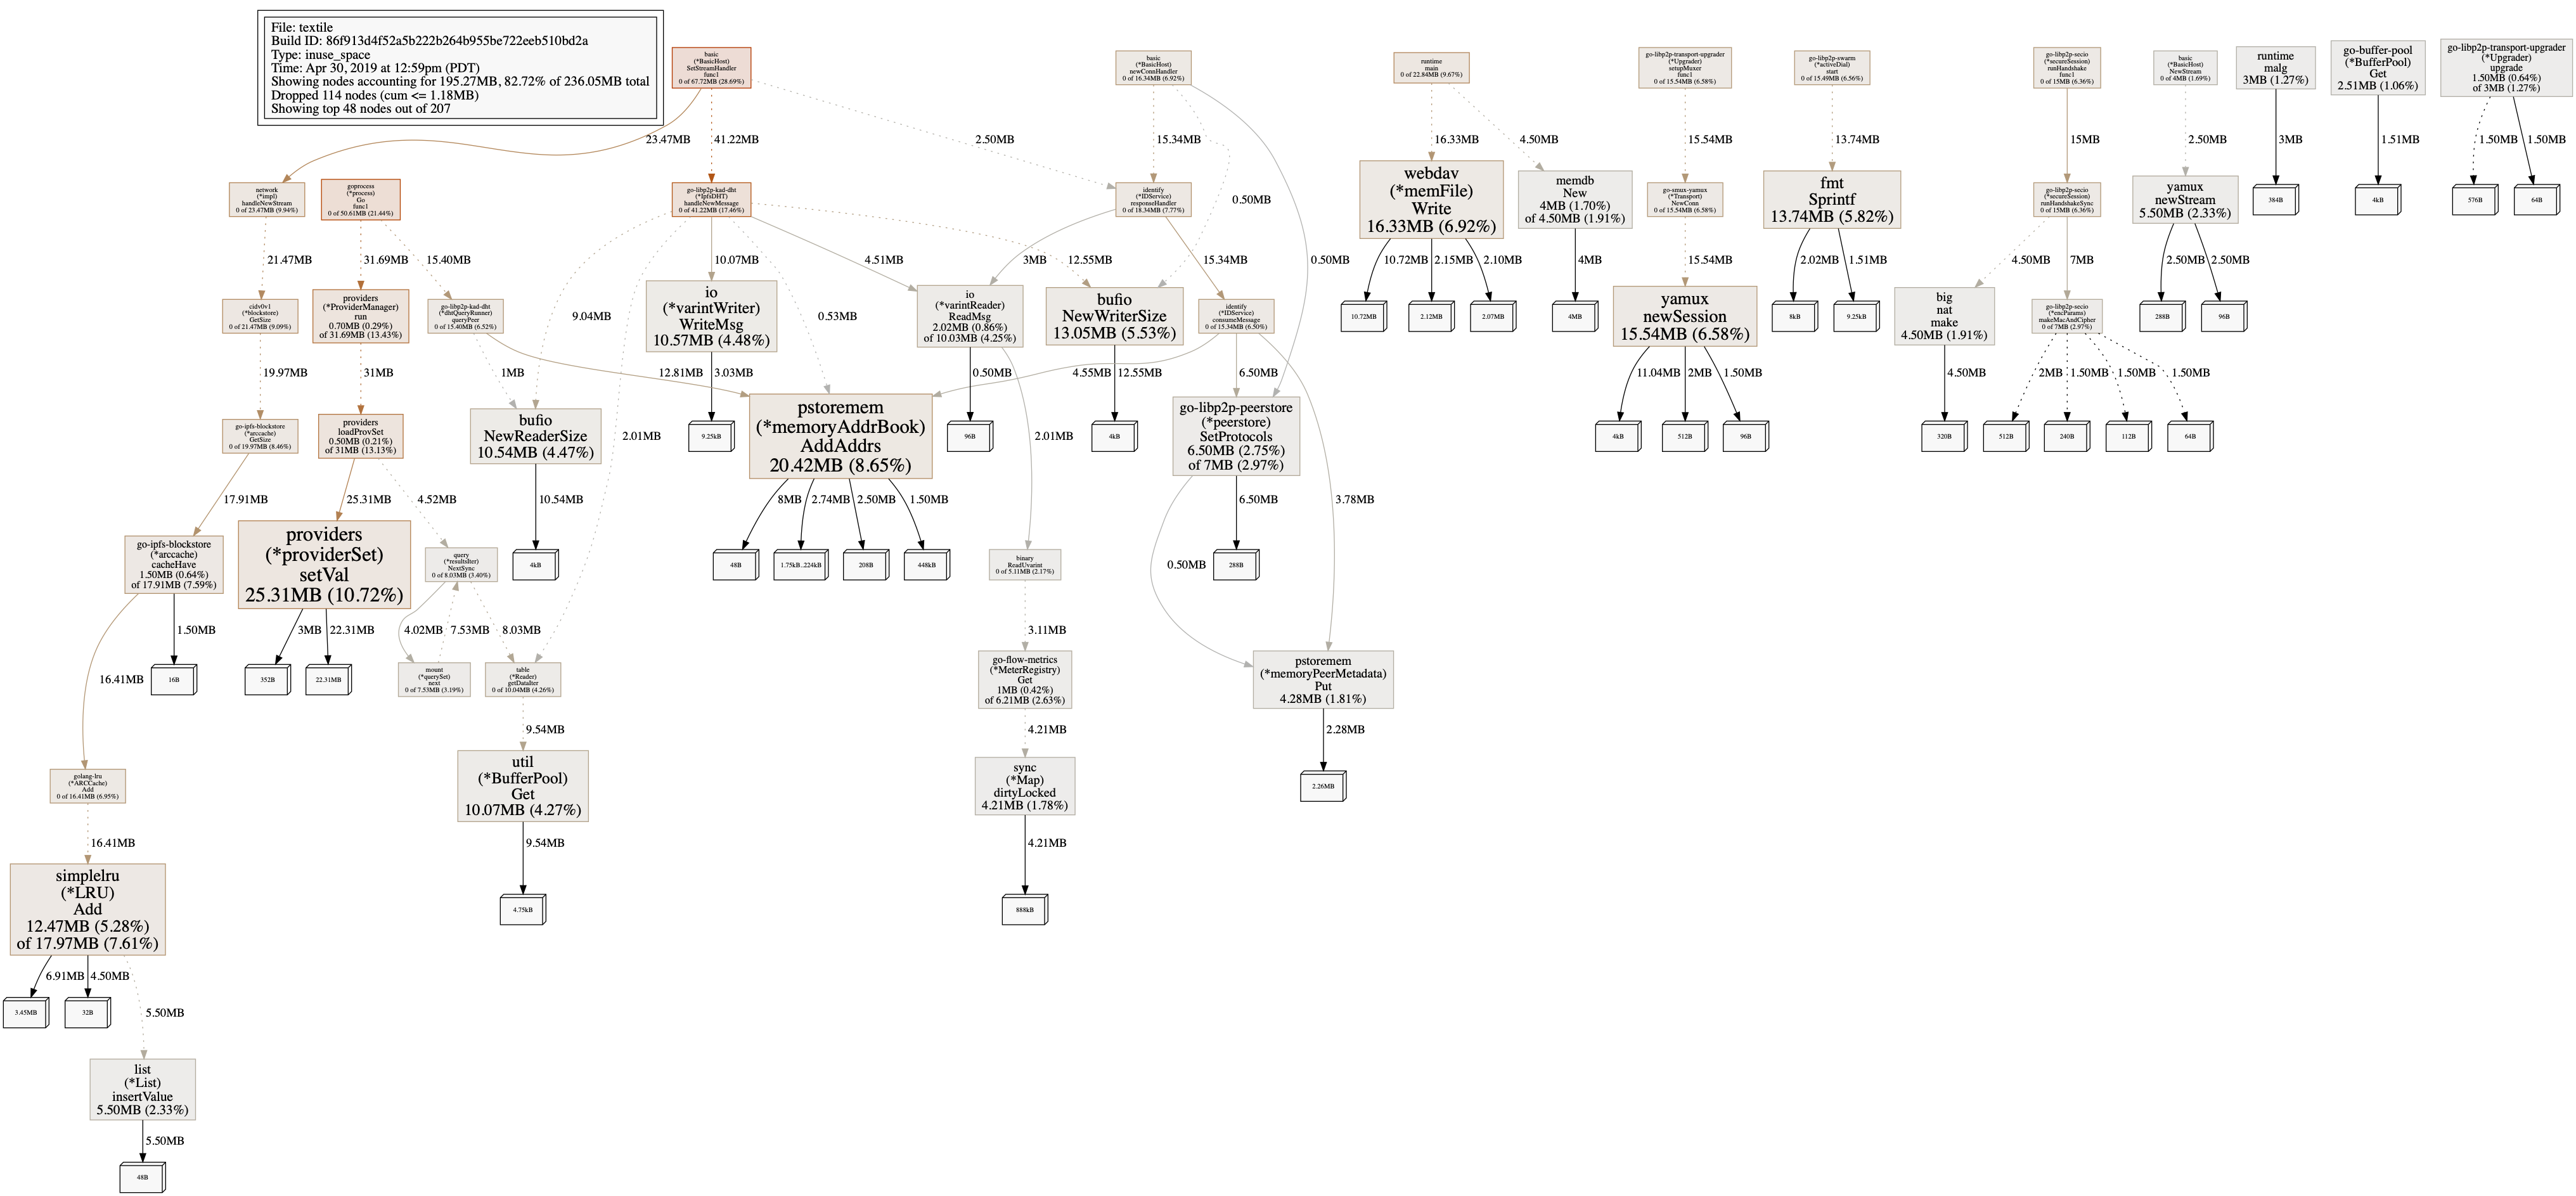
I'm seeing similar behavior on some of our gateways running embedded go-ipfs@0.4.20. The pattern seems to be:

1) Slightly higher than "normal" memory usage (20%-ish) 2) A period of very high CPU usage (GC?) with steadily increasing memory usage 3) Normal CPU usage, memory usage flat but now higher

That repeats until the machine is OOM. If I run a brand new go-ipfs peer (not embedded in textile), memory and CPU stay low. So, I'm still not sure if this is related to something in textile or to the fact that the node has more data, etc.

As requested:

[ec2-user@ip-172-31-12-235 ~]$ lsof -n -P -p $(pidof textile) | wc -l
902

Steps taken so far:

LimitNPROC=32768
LimitNOFILE=65536
Environment="IPFS_FD_MAX=65536"

Here's a profile collection captured during normal CPU levels (this is your collect_profiles script pointed at the textile binary):

https://s3-us-west-1.amazonaws.com/textile-profiles/dev/textile-profile-ip-172-31-12-235.us-west-1.compute.internal-2019-04-30T20%3A49%3A22%2B0000.tar.gz

Some PNGs of the profiles captured during high CPU usage:

goroutine_during_high_cpu high_cpu heap_during_high_cpu

sanderpick commented 5 years ago

Ok, I was able to grab a full collection captured during high CPU:

https://s3-us-west-1.amazonaws.com/textile-profiles/dev/textile-profile-ip-172-31-12-235.us-west-1.compute.internal-2019-04-30T21%3A54%3A17%2B0000.tar.gz

Stebalien commented 5 years ago

@sanderpick, your issue looks like an issue we just fixed in master concerning provider records. Could you try the latest master?

The file descriptor issue looks like a separate issue (at least nobody has reported that the latest master fixes it).

sanderpick commented 5 years ago

Thanks, @Stebalien. Master is looking a lot better.

hsanjuan commented 5 years ago

@hsanjuan Have you tried on smaller machines? something like 2 cores, 2/4GB RAM? More into the "consumer/desktop/notebooks" set of machine size?

I'd like to know this as well. While resources are always important, I'm curious to know how much of a role they play here. From inspecting my nodes after they hit this issue, they haven't seemed maxed out from a resource standpoint at all.

I have no tried with "normal" machines (or not long enough). I can say that the file descriptors are stable at around 5000-6000 after a couple of days on the cluster. About 60% of them on badger files and the rest are swarm connections.

koalalorenzo commented 5 years ago

@hsanjuan Thx! Sadly I can't ask Orion users to use 64GB of RAM.

I will wait for a fix before upgrading Orion to v0.4.2x. I guess that might impact the user experience, if the issue persists.

On the siderus.io gateway I have found a workaround but the problem persists in the logs. Any ETA on the fix? I will build the master and see how it performs.

hsanjuan commented 5 years ago

@koalalorenzo The 64GB of RAM are because those machines handle 2TB+ of repository size, but except some spikes, half of the RAM is unused.

The workaround here is to either increase the FD limit from the default (see post above), or reduce the ConnManager limits so there are less connections or play with the badger configuration so it opens less files (I haven't tried this but I think the ipfs config allows to play with all badger options).

I'm not sure at this point if there is an increased FD usage related to just BadgerDS or just connections or both (maybe someone can verify against 0.4.19).

koalalorenzo commented 5 years ago

0.4.18 and 0.4.19 have been working better compared to 0.4.20. I tried to set the env variable IPFS_FD_MAX to 65536, but nothing changed (after 6h of running the problem persists). My workaround is relying on a LB, and I would like to not rely on changing settings: I am using "out of the box" conf from default, as I would like to help debug this if needed. :-)

Any ETA on the release of this fix? (I still need to test master)

hsanjuan commented 5 years ago

I tried to set the env variable IPFS_FD_MAX to 65536

For that to work you probably also need to increase the FD hard limit in the system (ulimit etc). ipfs prints an error if it cannot set the given IPFS_FD_MAX during boot. But a more conservative value of 8000 should be enough.

koalalorenzo commented 5 years ago

Any ETA on the release of this fix?

Stebalien commented 5 years ago

Any ETA on the release of this fix?

I'm not even sure what's causing this.

My theories are:

  1. Some change in the datastore query logic. I actually made quite a few changes so this sounds reasonable but I haven't yet seen any file descriptor lists that would indicate this. @hsanjuan has a lot but he also has a lot of data.
  2. The network is more chatty. This probably isn't the case as that should also affect 0.4.19. Well, actually, I think this may also be the case but it can't be the only issue.
  3. We're leaking file descriptors. I've seen absolutely no evidence of this and @hsanjuan's assertion that we level off at ~5000 file descriptors indicates that this is not true.
  4. We're creating more connections. This is what I'm currently thinking due to #6291 and #6286. My theory is that https://github.com/libp2p/go-libp2p-peerstore/pull/67 is causing us to continue DHT queries longer than we would have before the change.

Could one or both of you try https://github.com/ipfs/go-ipfs/tree/test/6237?

I'm not sure at this point if there is an increased FD usage related to just BadgerDS or just connections or both (maybe someone can verify against 0.4.19).

This would be really helpful in eliminating datastore issues. Note: I'm pretty sure it's not badger. We did update badger but non-badger users are also seeing this.

Stebalien commented 5 years ago

So, I've finally reproduced this on one of our machines and it looks like we're getting a bunch of inbound connections.

So, the question is, is this a regression? Does downgrading actually help? It could actually be 4 from above but be a client-side issue where our clients are now DOSing the network, connecting to all DHT nodes.

Stebalien commented 5 years ago

Nevermind, I think this is a bug. I think we're hanging when closing connections somewhere.

obo20 commented 5 years ago

@Stebalien It might be interesting to note that a node of mine running 0.4.19 ran into this last night. The issue only seemed to last very briefly, as the node quickly recovered.

So it seems like this issue is possible on past nodes, however reverting from 0.4.20 somehow makes it happen less often.

Stebalien commented 5 years ago

So, I've found an issue which is likely the cause (although I'm not entirely sure what's new). Basically, the connection manager gets stuck closing connections because some of the connections are hanging on close.

Fix incoming.

dokterbob commented 5 years ago

@Stebalien Great. Feel free to ship me a binary if you need to test in production.

Stebalien commented 5 years ago

Fix still in progress, unfortunately. See the discussion on https://github.com/libp2p/go-libp2p-circuit/pull/76.

Stebalien commented 4 years ago

@dokterbob could you try building https://github.com/ipfs/go-ipfs/pull/6361? I've been running this for a while on one of our boot strappers and it appears to be pretty stable.

Stebalien commented 4 years ago

Reopening waiting on confirmation. The latest master should now have all the required fixes.

koalalorenzo commented 4 years ago

Will build & check it tomorrow! Thx for the update

Stebalien commented 4 years ago

@koalalorenzo and @obo20, please use https://github.com/ipfs/go-ipfs/pull/6368 and not master till I get some reviews on the libp2p patches and merge it into master.

TL;DR: There was a bug in libp2p since time immortal. We fixed it this release cycle (https://github.com/ipfs/go-ipfs/pull/6368) but then introduced a feature that triggers this bug. The branch I linked to above removes this feature.

Stebalien commented 4 years ago

The RC3 (https://github.com/ipfs/go-ipfs/issues/6237) contains the fix. Any updates?

koalalorenzo commented 4 years ago

3 hours of running on 30% of the fleet. Still monitoring, nothing happened so far. I will wait for 24h to be sure :)

obo20 commented 4 years ago

@Stebalien Running on a few of our nodes right now. Things seem to be working well so far.

Stebalien commented 4 years ago

Awesome! Let me know if anything changes. We'll probably ship a final release Monday.

graylan0 commented 4 years ago

Running for the past day as well as some friends who also set it up on their nodes, I average around 850 - 900 peers. They average around the same. And the Ram usage is much less (5x).

Stebalien commented 4 years ago

Ok. Considering this closed, let the release train roll...

Stebalien commented 4 years ago

Also, a big thank you to everyone in this thread for helping debug this!

sanderpick commented 4 years ago

Looking good here too! Thank you @Stebalien

dokterbob commented 4 years ago

For future reference (I'm about to upgrade to the rc1 now). ssp_temp_capture

Memory usage is just IPFS.

Stebalien commented 4 years ago

@dokterbob please upgrade to the RC3, not the RC1. The RC1 doesn't include the fix for this bug.