 jasonish
commented
6 years ago
jasonish
commented
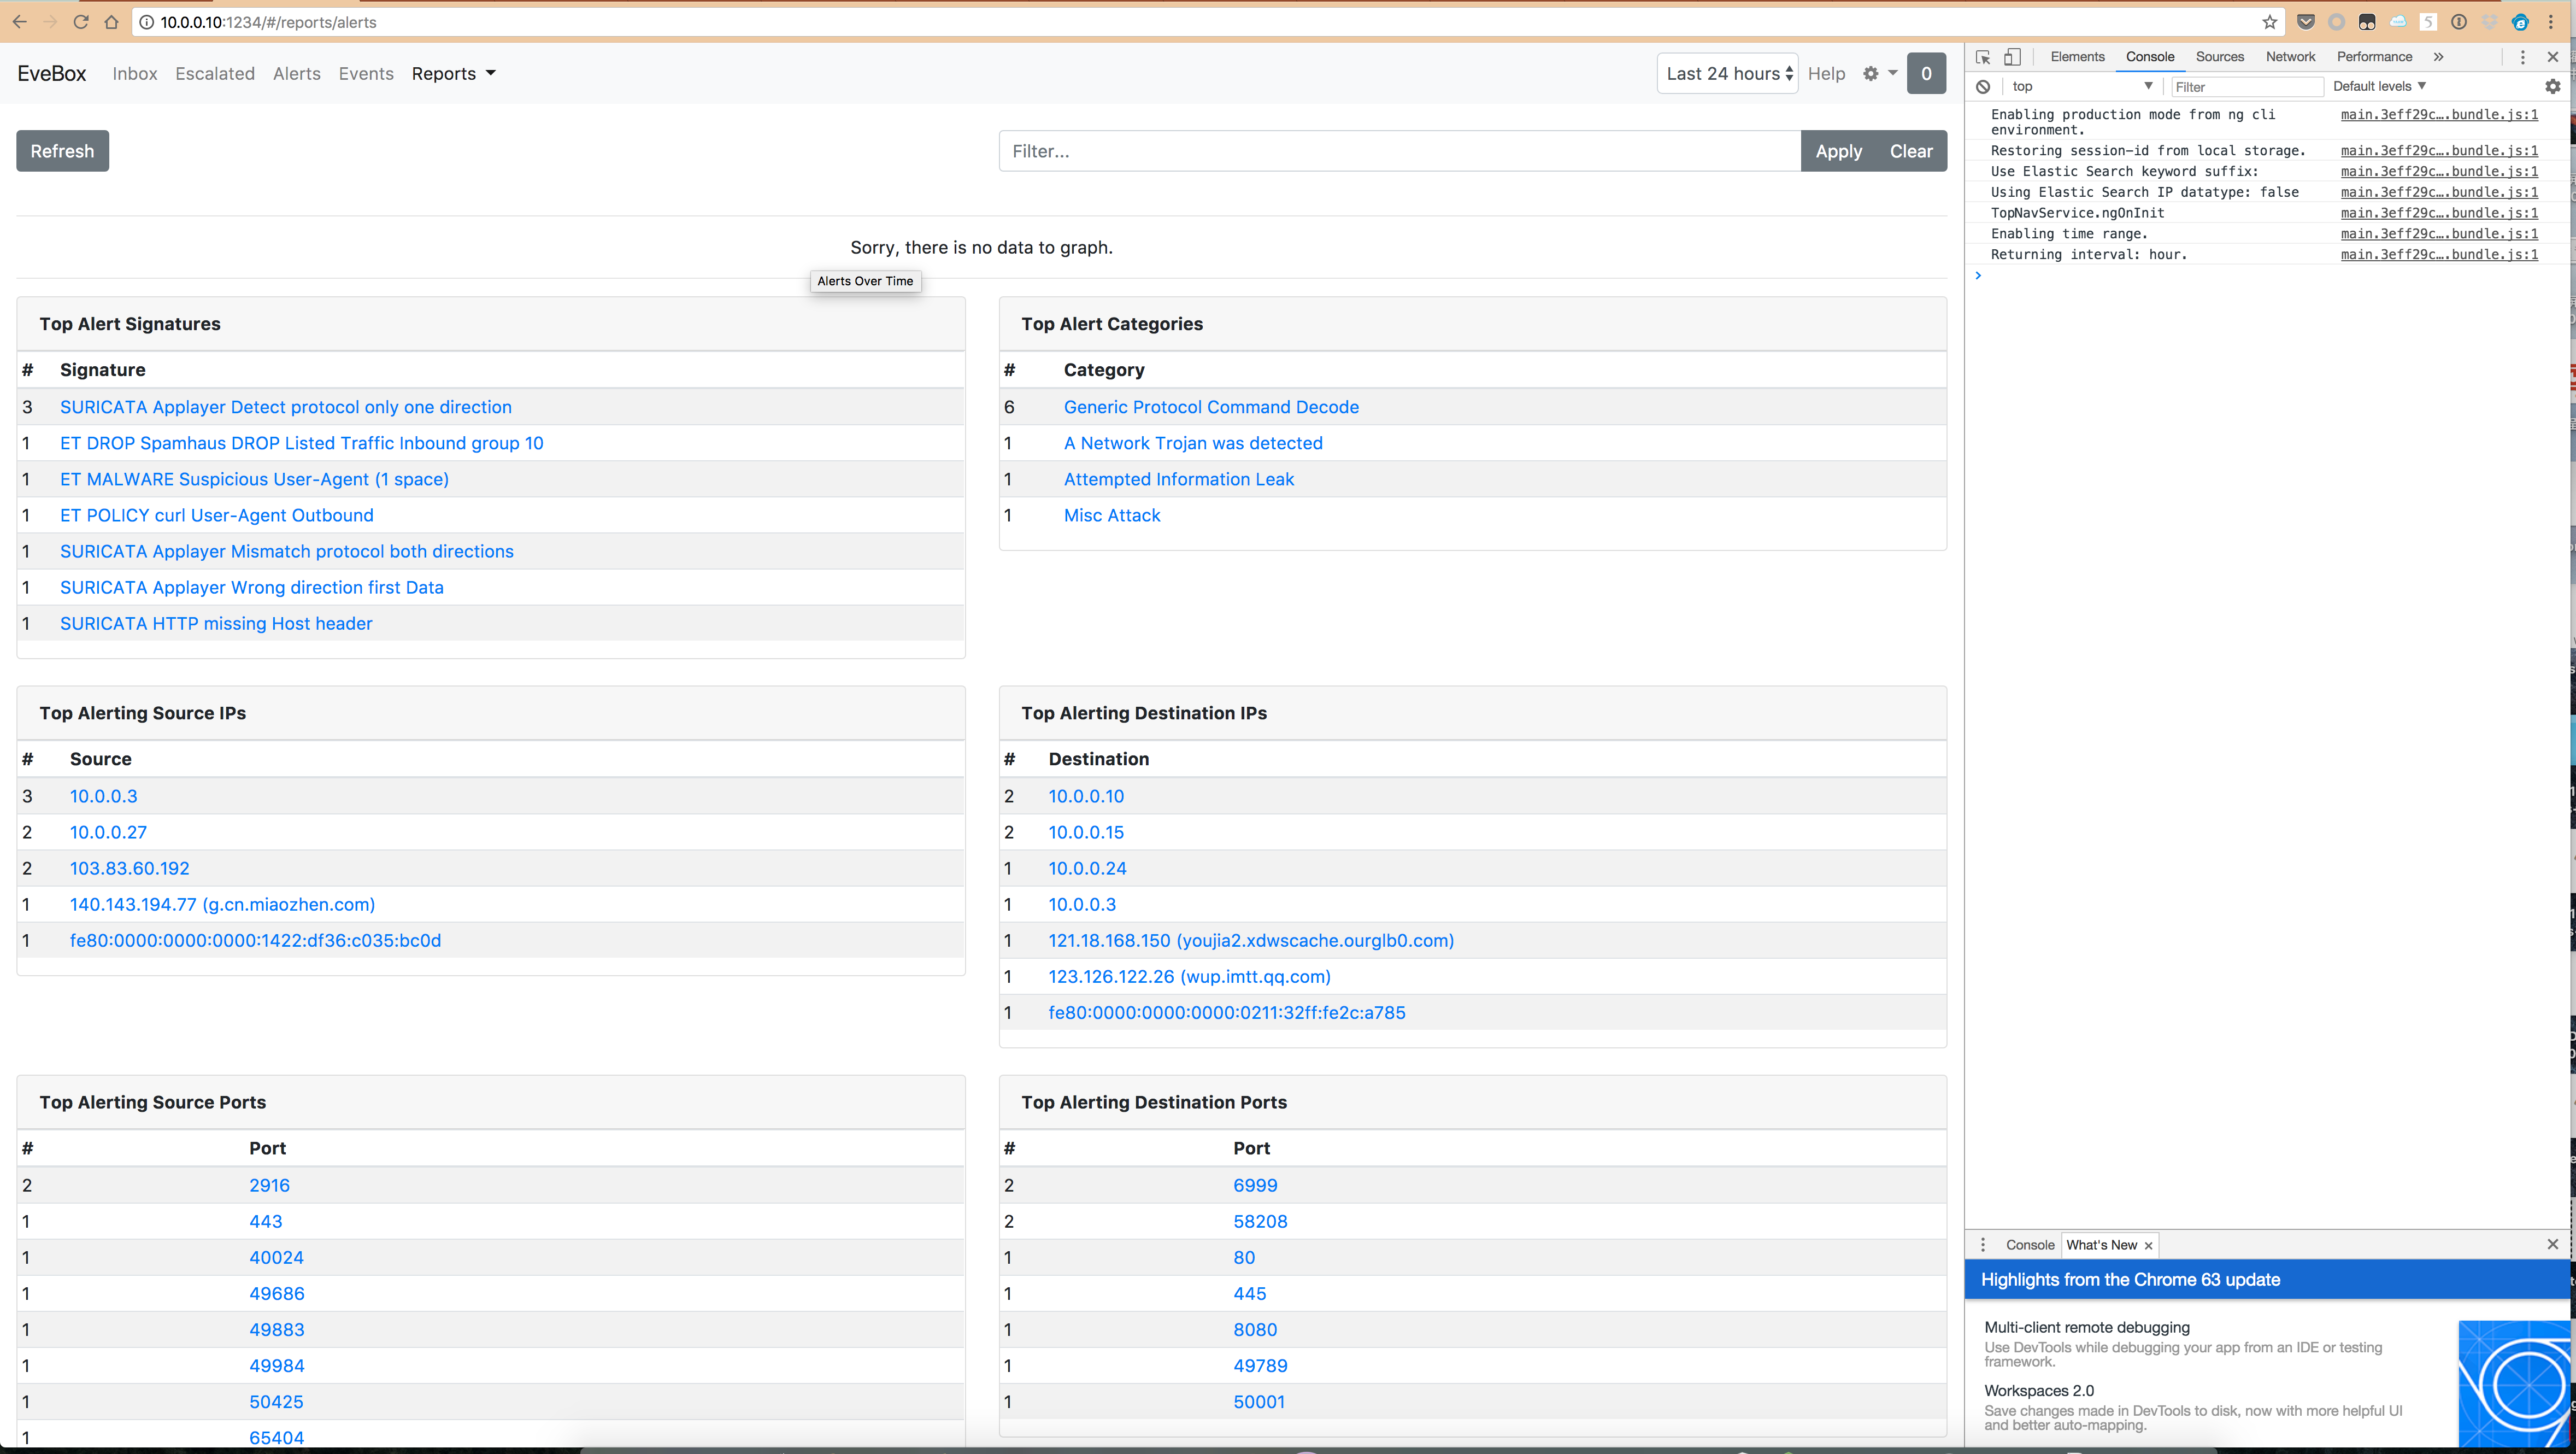
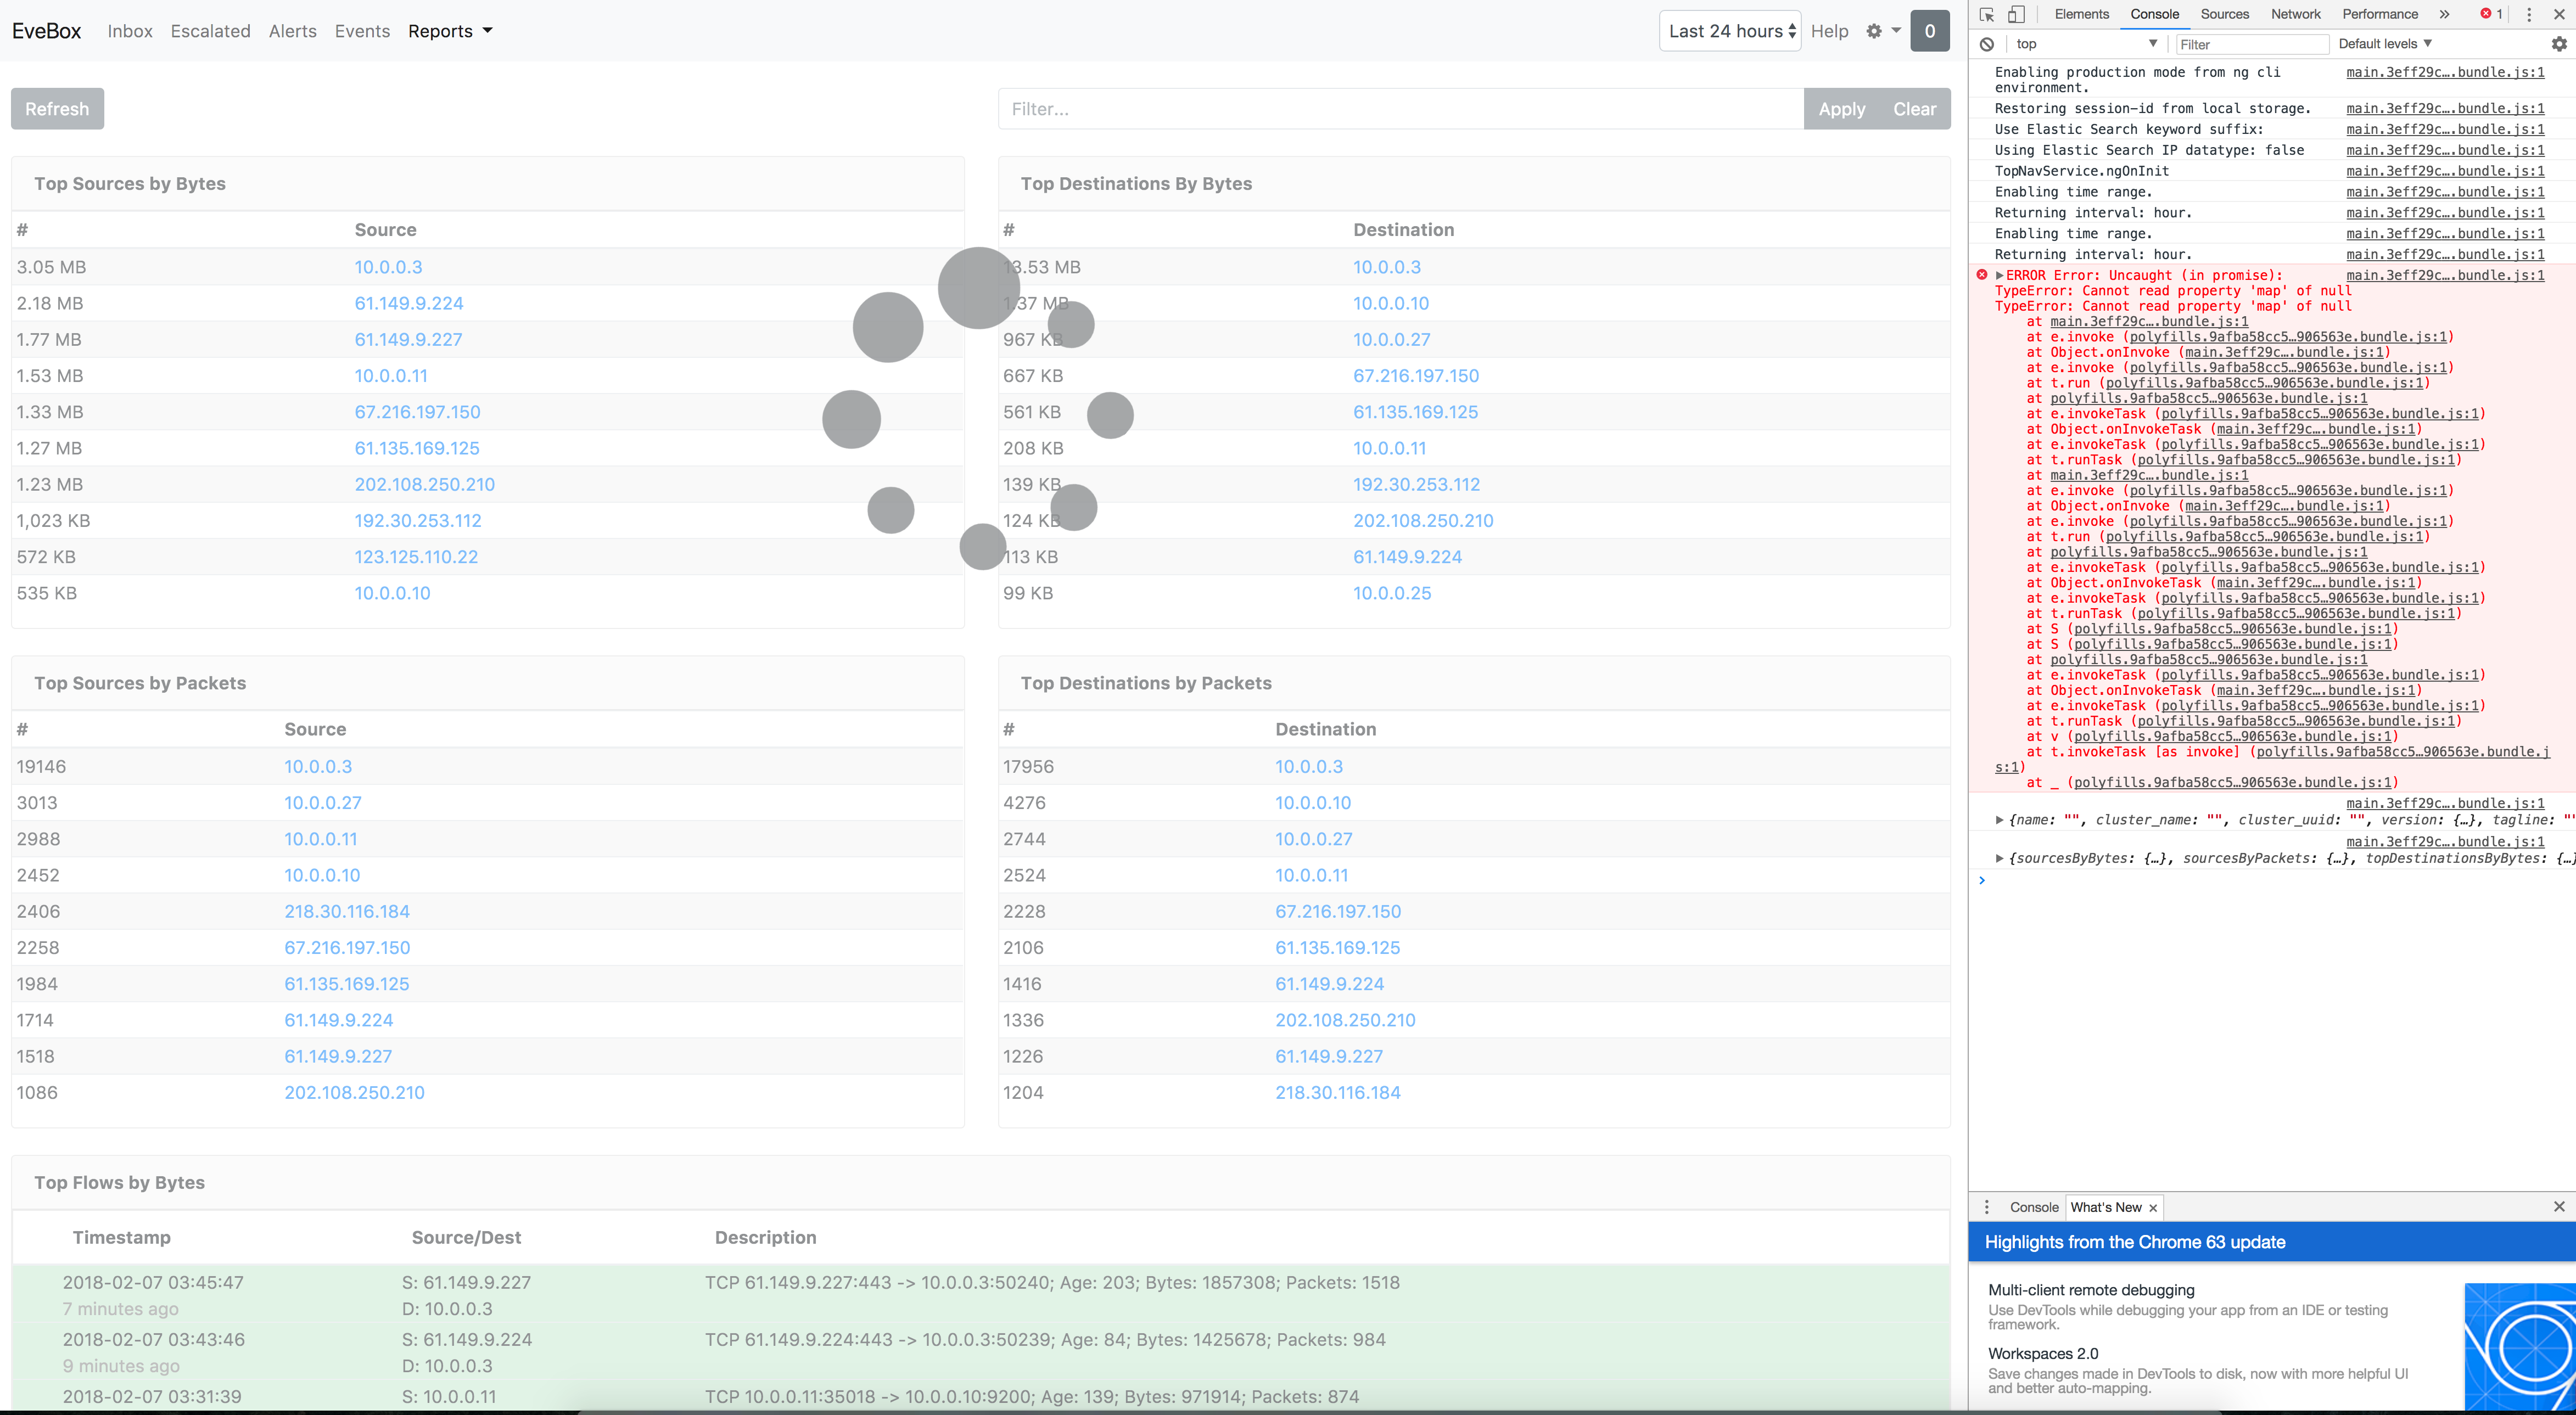
6 years ago Do the Inbox/Alerts/Events views work? Which report doesn't work.
Please tell me your versions of Logstash, Filebeat and Elastic Search. There are currently problems with version 6 of the ELK stack.
 swe3per
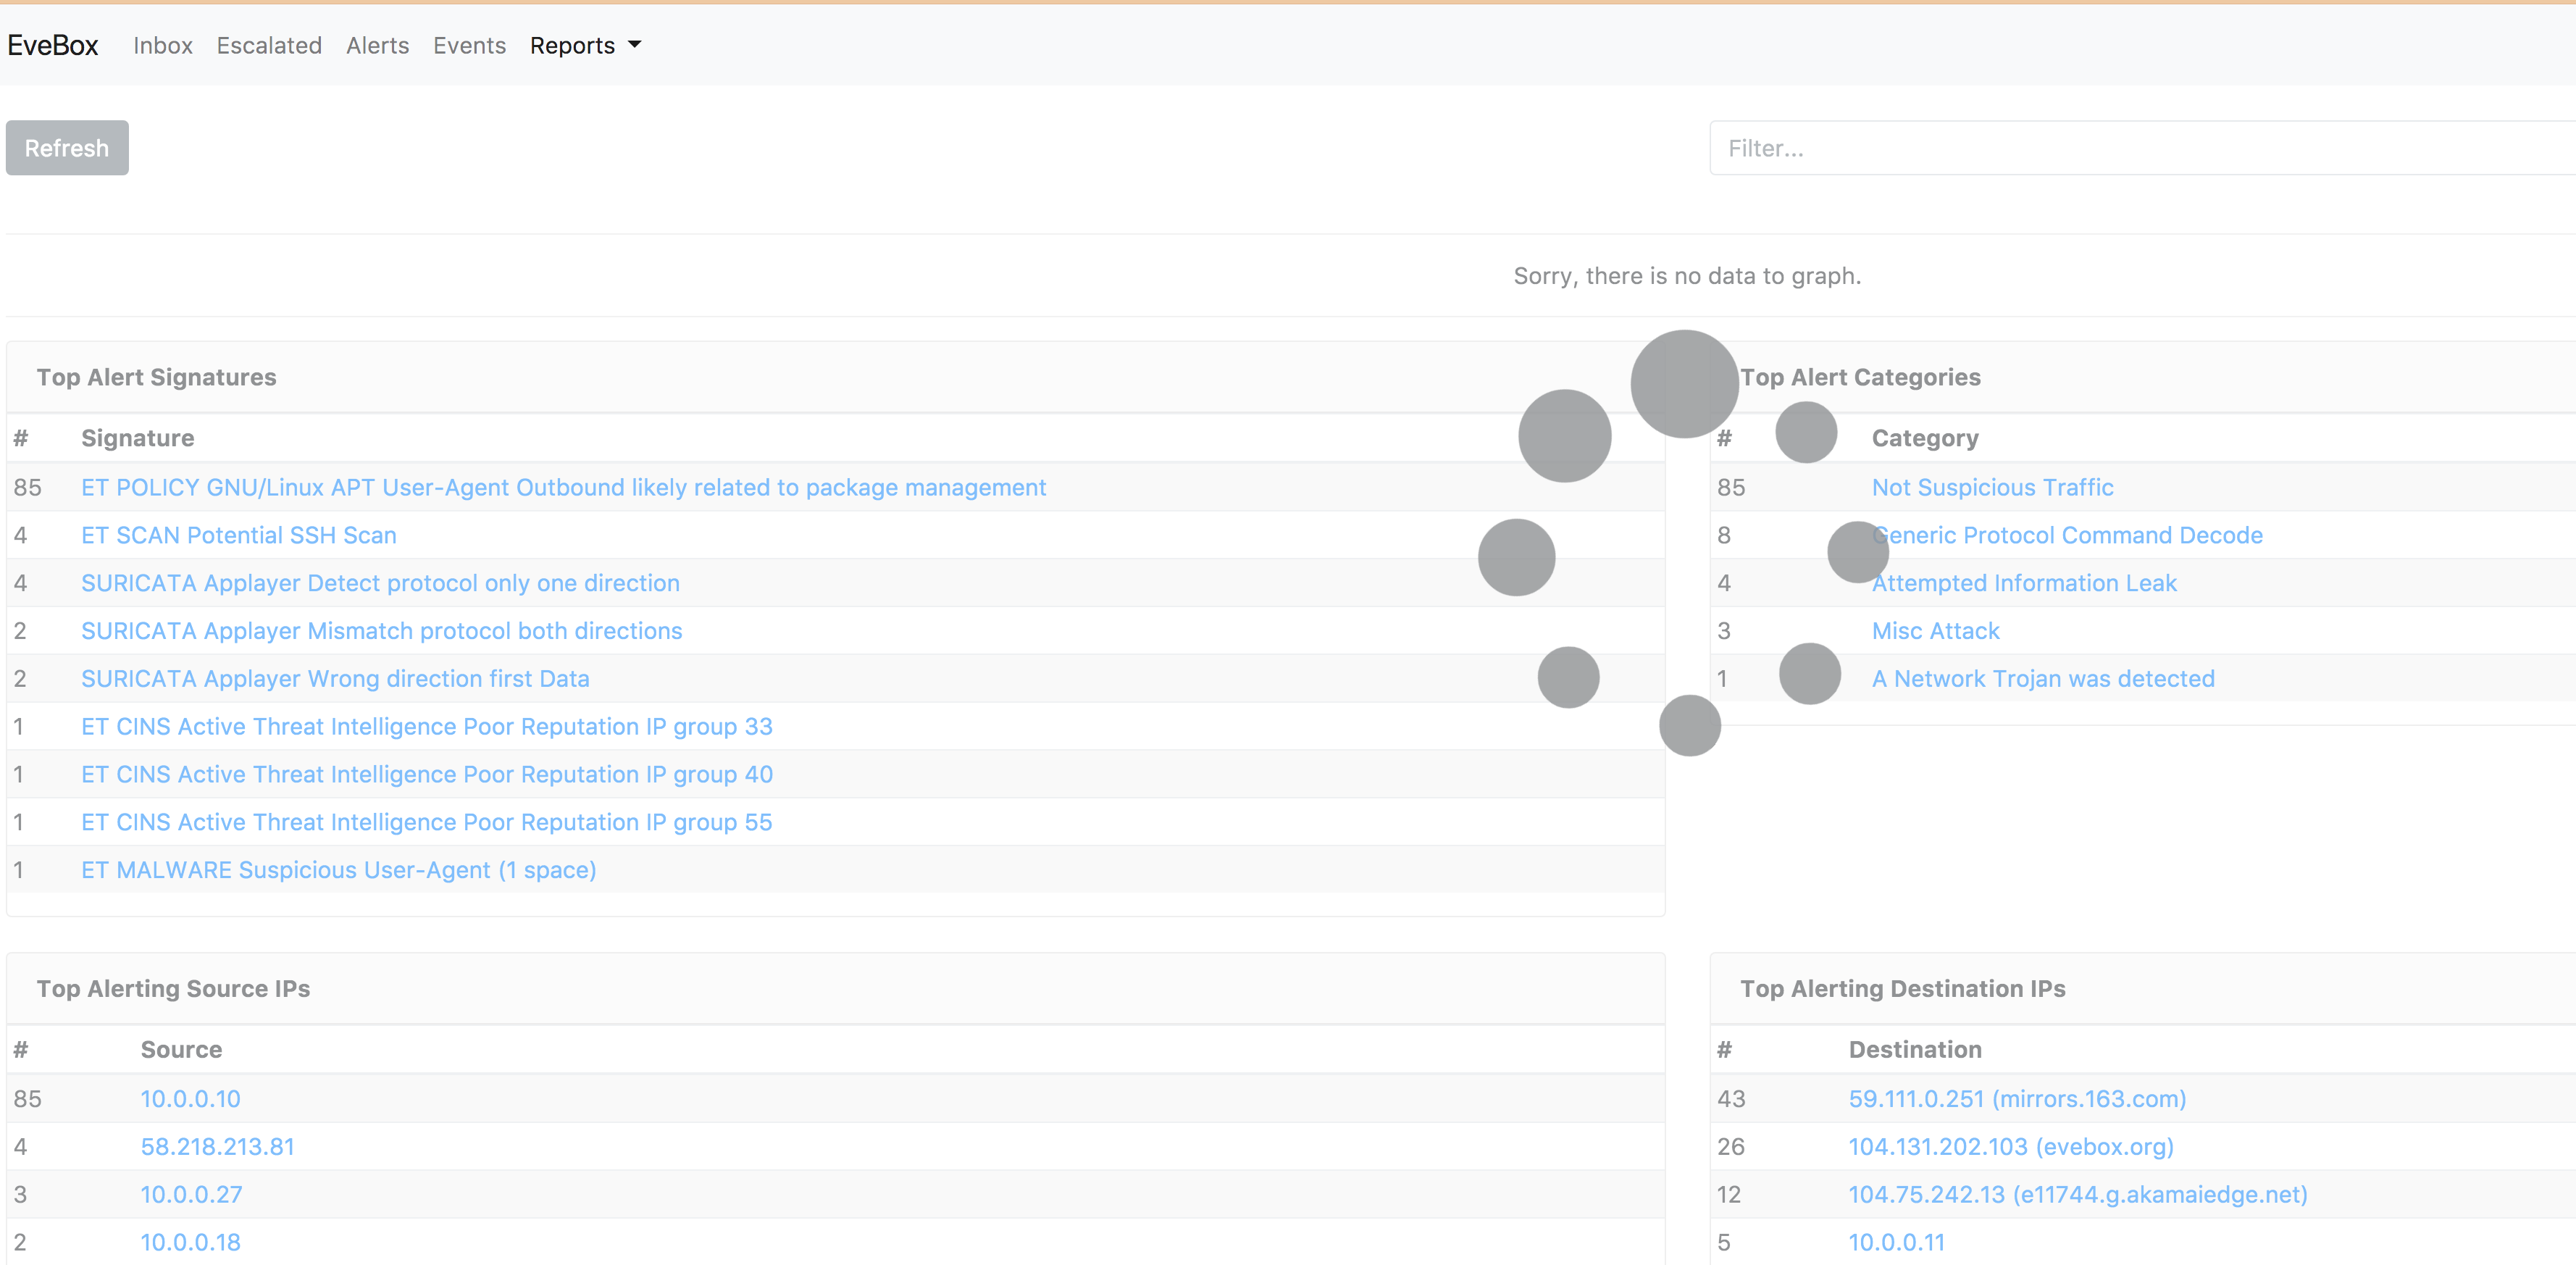
os:debian8 x64 version:EveBox Version 0.9.0dev (rev 47beb37) use repository to install evebox mechine A:suricata + filebeat mechine B:ELK + evebox in stable/unstable version evebox report no graph, in the dev version report page allways "loadding.."