 jcoliver
commented
1 month ago
jcoliver
commented
1 month ago Quite idiosyncratic - only seems to come about when plotting contemporary model of A. californica + Q. chrysolepis. :thinking:
Open jcoliver opened 1 month ago
jcoliver
commented
1 month ago Quite idiosyncratic - only seems to come about when plotting contemporary model of A. californica + Q. chrysolepis. :thinking:
jcoliver
commented
1 month ago Try going through a terra::sprc()...?
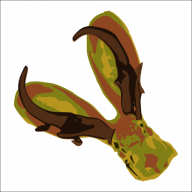
Output raster is messed up. Example from A. californica:
Image comes from scripts/examples/Adelpha_californica-sdm-pairwise.R; butterfly and plant rasters are fine (print the outputs from these two lines to see):