 MichalBurgunder
commented
3 years ago
MichalBurgunder
commented
3 years ago For those wanting to get their CI pipeline going with jest@26, I found a workaround that works for me. (this issue comment helped, combined with this explanation). I increased the maximum oldspace on node, and although the leak persists, my CI pipeline seems to be doing better/passing. Here my package.json input:
"test-pipeline": "node --max-old-space-size=4096 ./node_modules/.bin/jest --runInBand --forceExit --logHeapUsage --bail",
What else I tried and scraped together from a few other issues:
- used the above fix: exposed garbage collector (i.e.
node --expose-gc ./node_modules/...) && used theafterEach(did nothing) - inspected the port where my my server was running (from here, increasing heap seemed invisible to the inspector, while at the same time responding to changes)
- patched graceful-fs with this. Probably taken from this issue, but it did nothing
 barry800414
 rgoldfinger-quizlet
 tsairinius
 armingjazi
 SimonGodefroid
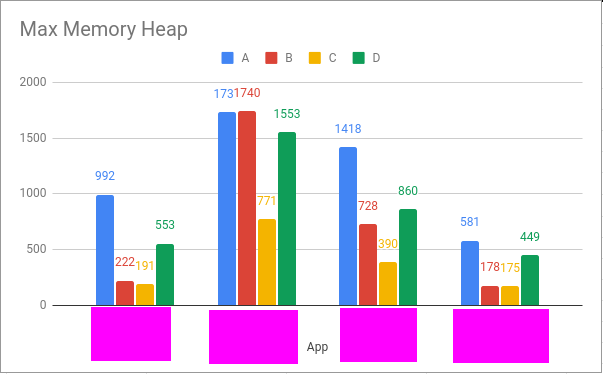
 pastelsky
 viceice
 BlackGlory
 Npervic
 Penagwin
 origamih
 pbrain19
 milesj
 elorusso
 fazouane-marouane
 Dakuan
 darekg11
 radcapitalist
 jaredjj3
 StringEpsilon
 SimenB

 UnleashSpirit
 Moumouls
 j0k3r
j0k3r michalstrzelecki
 mbyrne00
 pleunv
You guys do an awesome job and we all appreciate it! 🎉
🐛 Bug Report
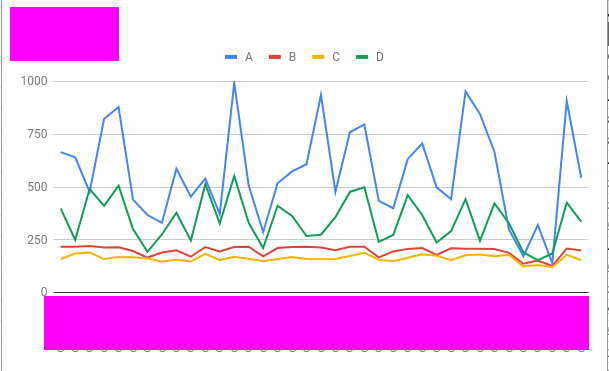
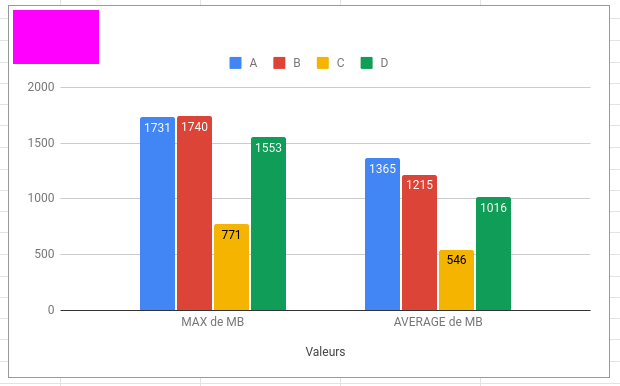
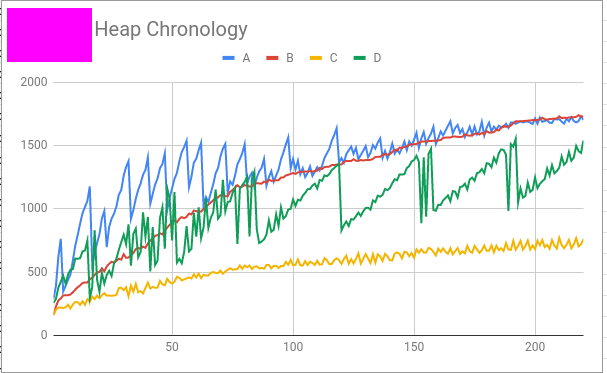
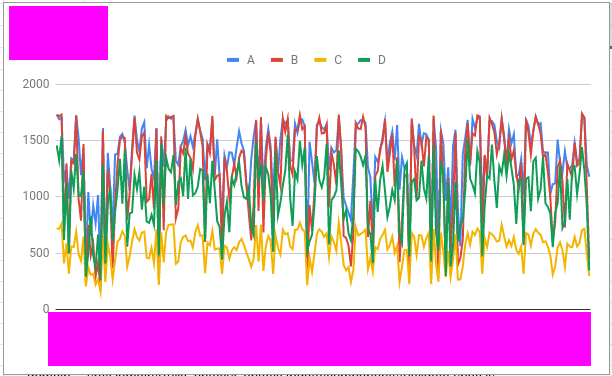
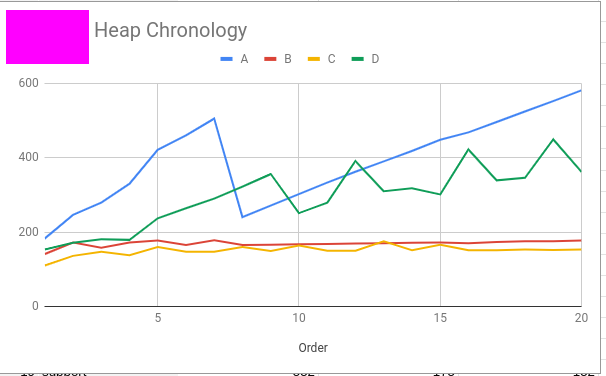
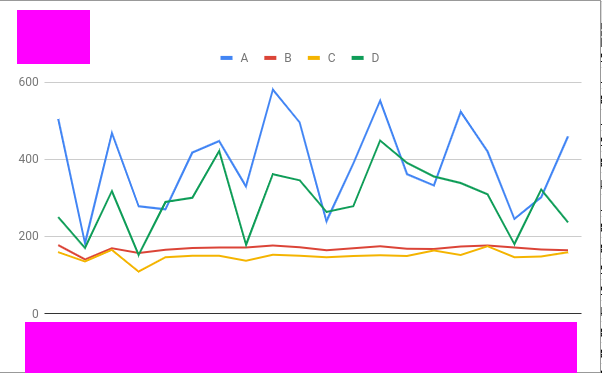
On a work project we discovered a memory leak choking our CI machines. Going down the rabbit hole, I was able to recreate the memory leak using
Jestalone.Running many test files causes a memory leak. I created a stupid simple repo with only
Jestinstalled and 40 tautological test files.I tried a number of solutions from https://github.com/facebook/jest/issues/7311 but to no avail. I couldn't find any solutions in the other memory related issues, and this seems like the most trivial repro I could find.
Workaround :'(
We run tests with
--expose-gcflag and adding this to each test file:To Reproduce
Steps to reproduce the behavior:
Expected behavior
Each test file should take the same amount of memory (give or take)
Link to repl or repo (highly encouraged)
https://github.com/javinor/jest-memory-leak
Run
npx envinfo --preset jestPaste the results here: