Hi there!
For (1) I'm so sorry, but there is currently no way to stack monitors on top of each other in the same graph. I'll add this as a feature request for the next major version.
For (2) yes, you can customize the disk monitoring system to look at other mounts. The way to do this is to add a new monitor that looks at a different mount in the metrics data.
For example if you look at the current Disk Usage monitor, you'll see:

You can add a new monitor that looks at a different mount. Click the "Explore" button to see which data is available to you:

If you have any other disk mounts, they should be shown here, and you can create a monitor that points to one.
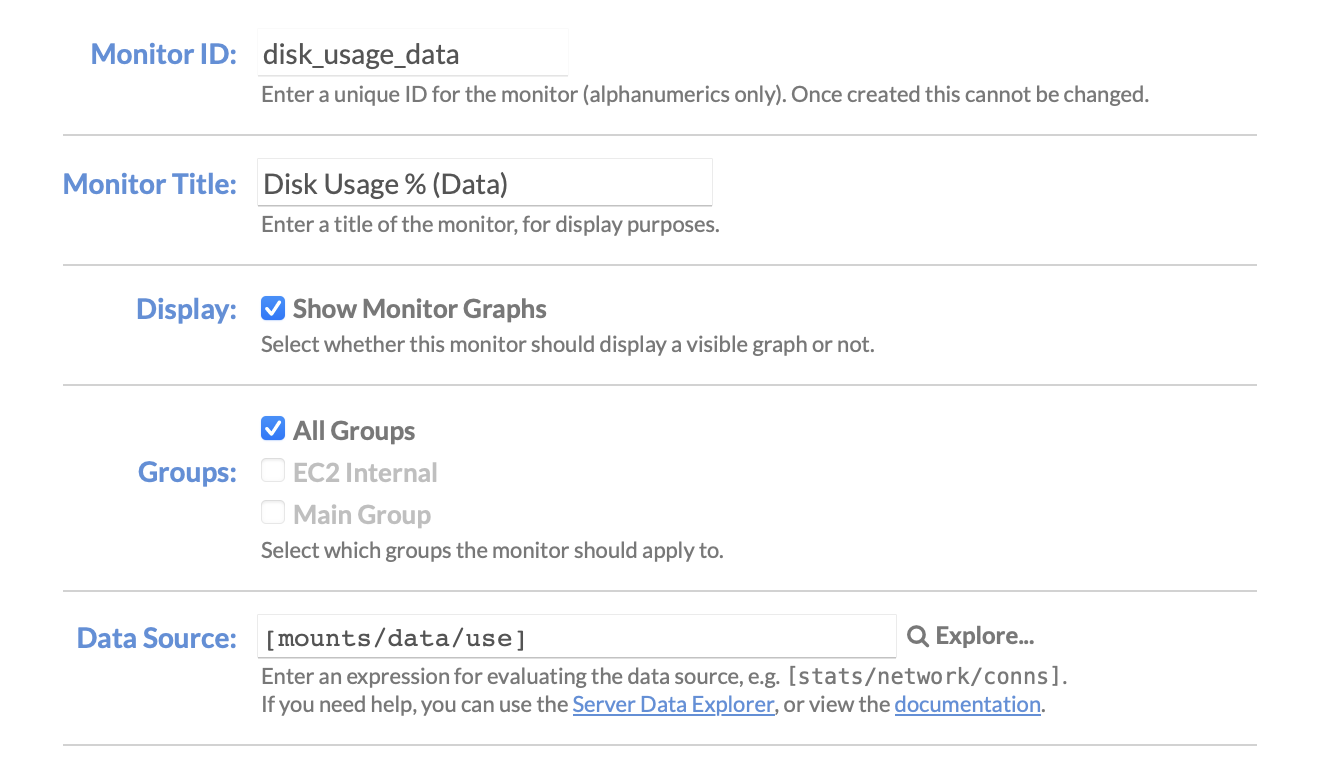
For e.g. on one of my servers I have a "data" mount that I monitor separately:

Good luck!
Hey mate,
Awesome tool!
Few questions: