 jmonlong
commented
9 months ago
jmonlong
commented
9 months ago This function was used to "flip" the alignments, basically pretending that the alignment was done on the reverse complement. In my example, it was used to go from
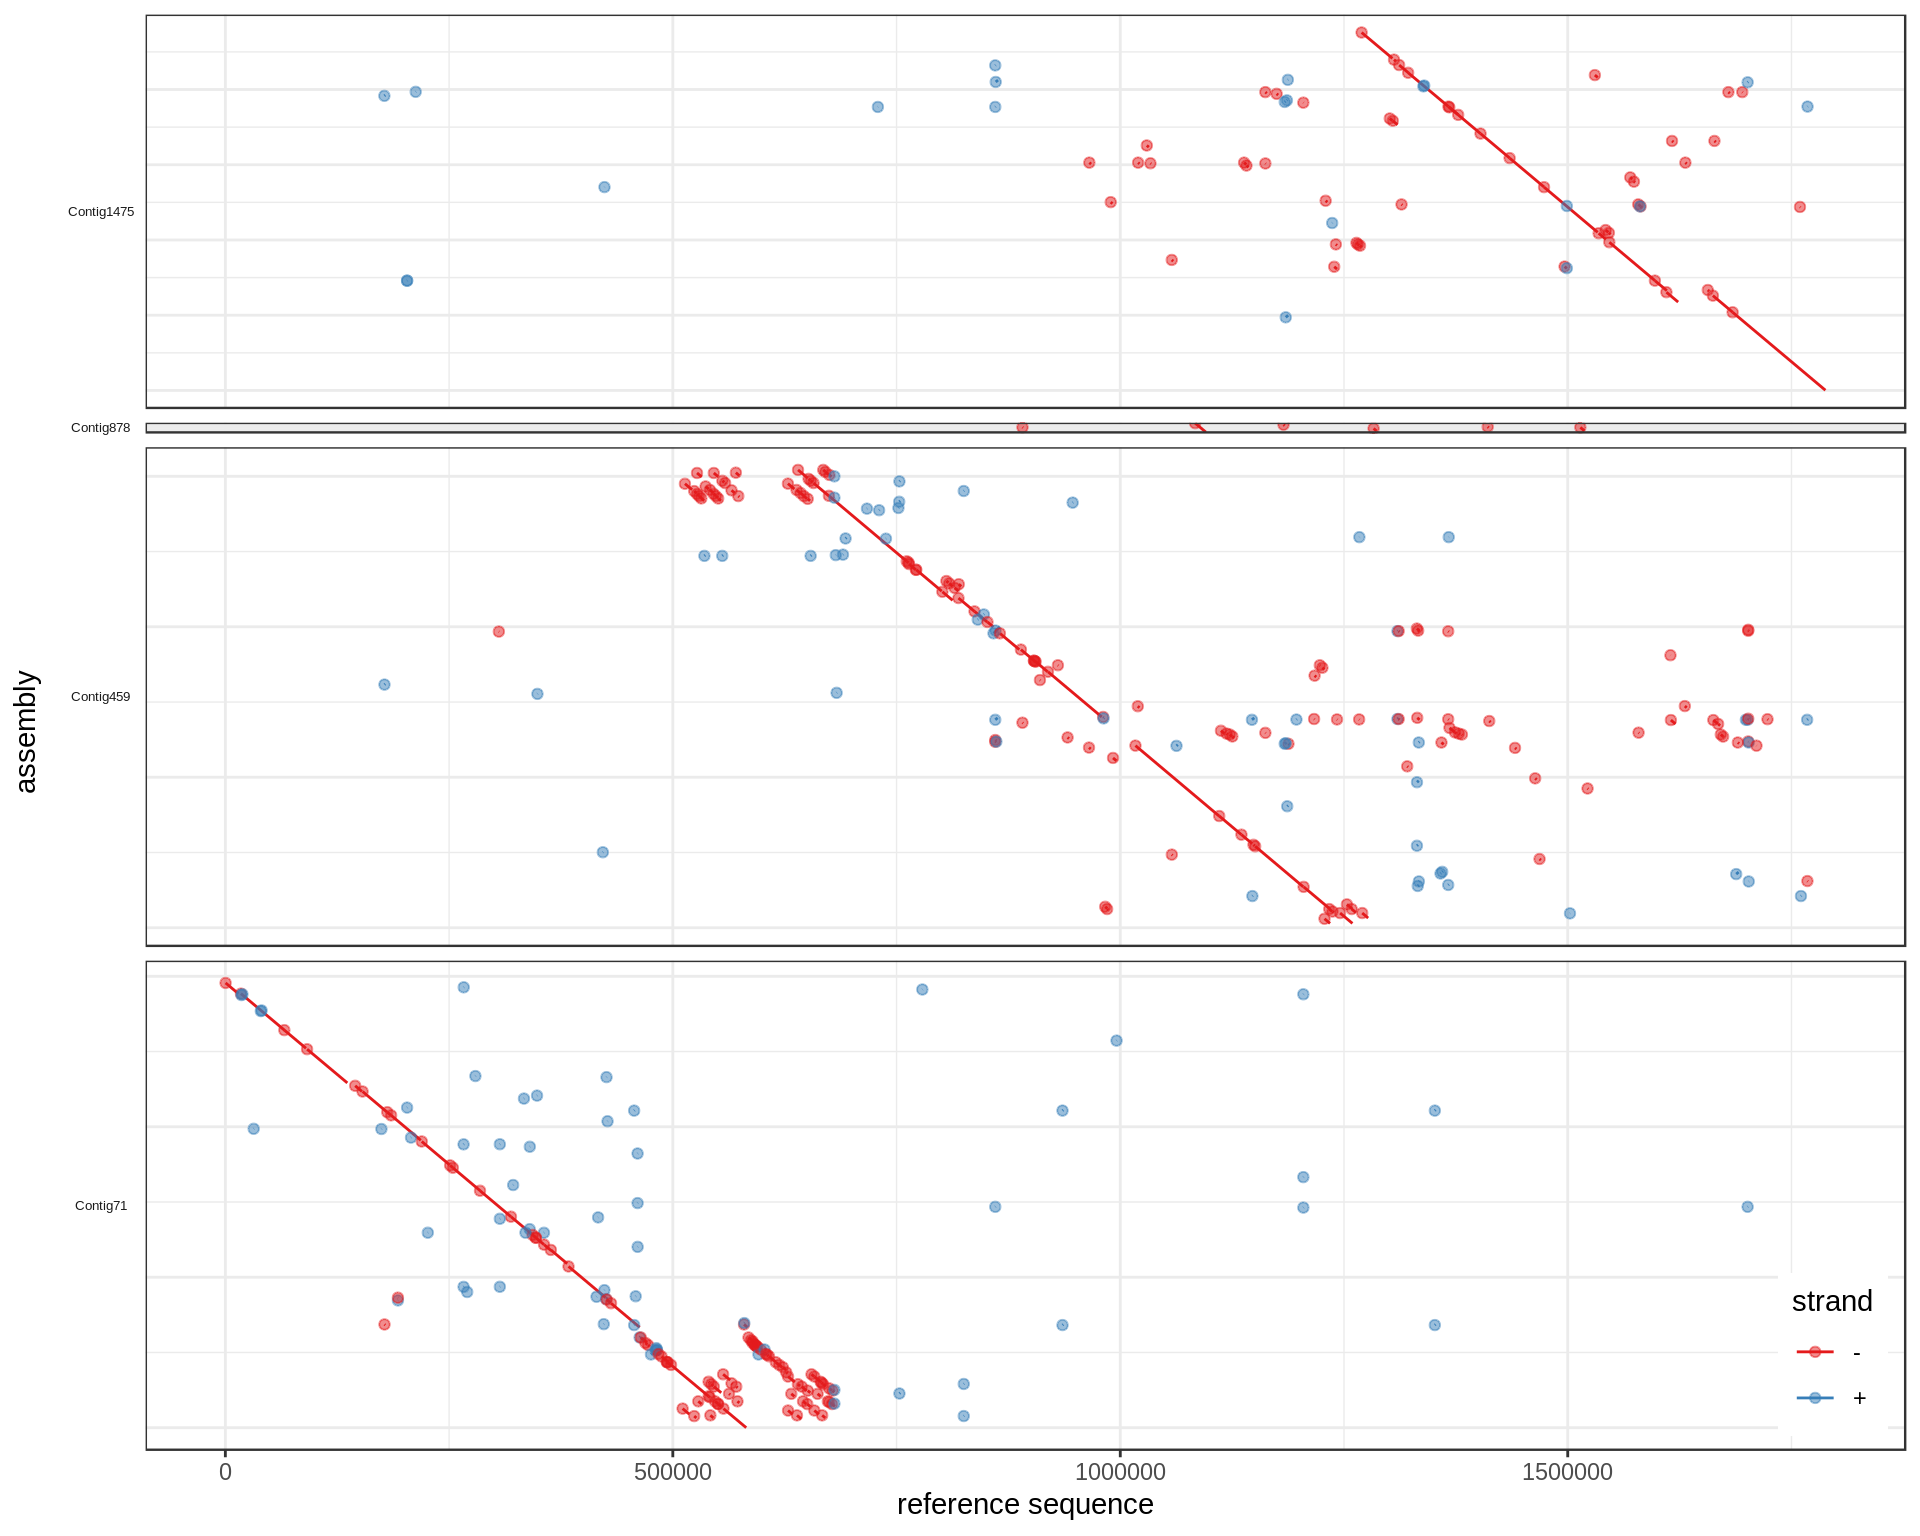
to
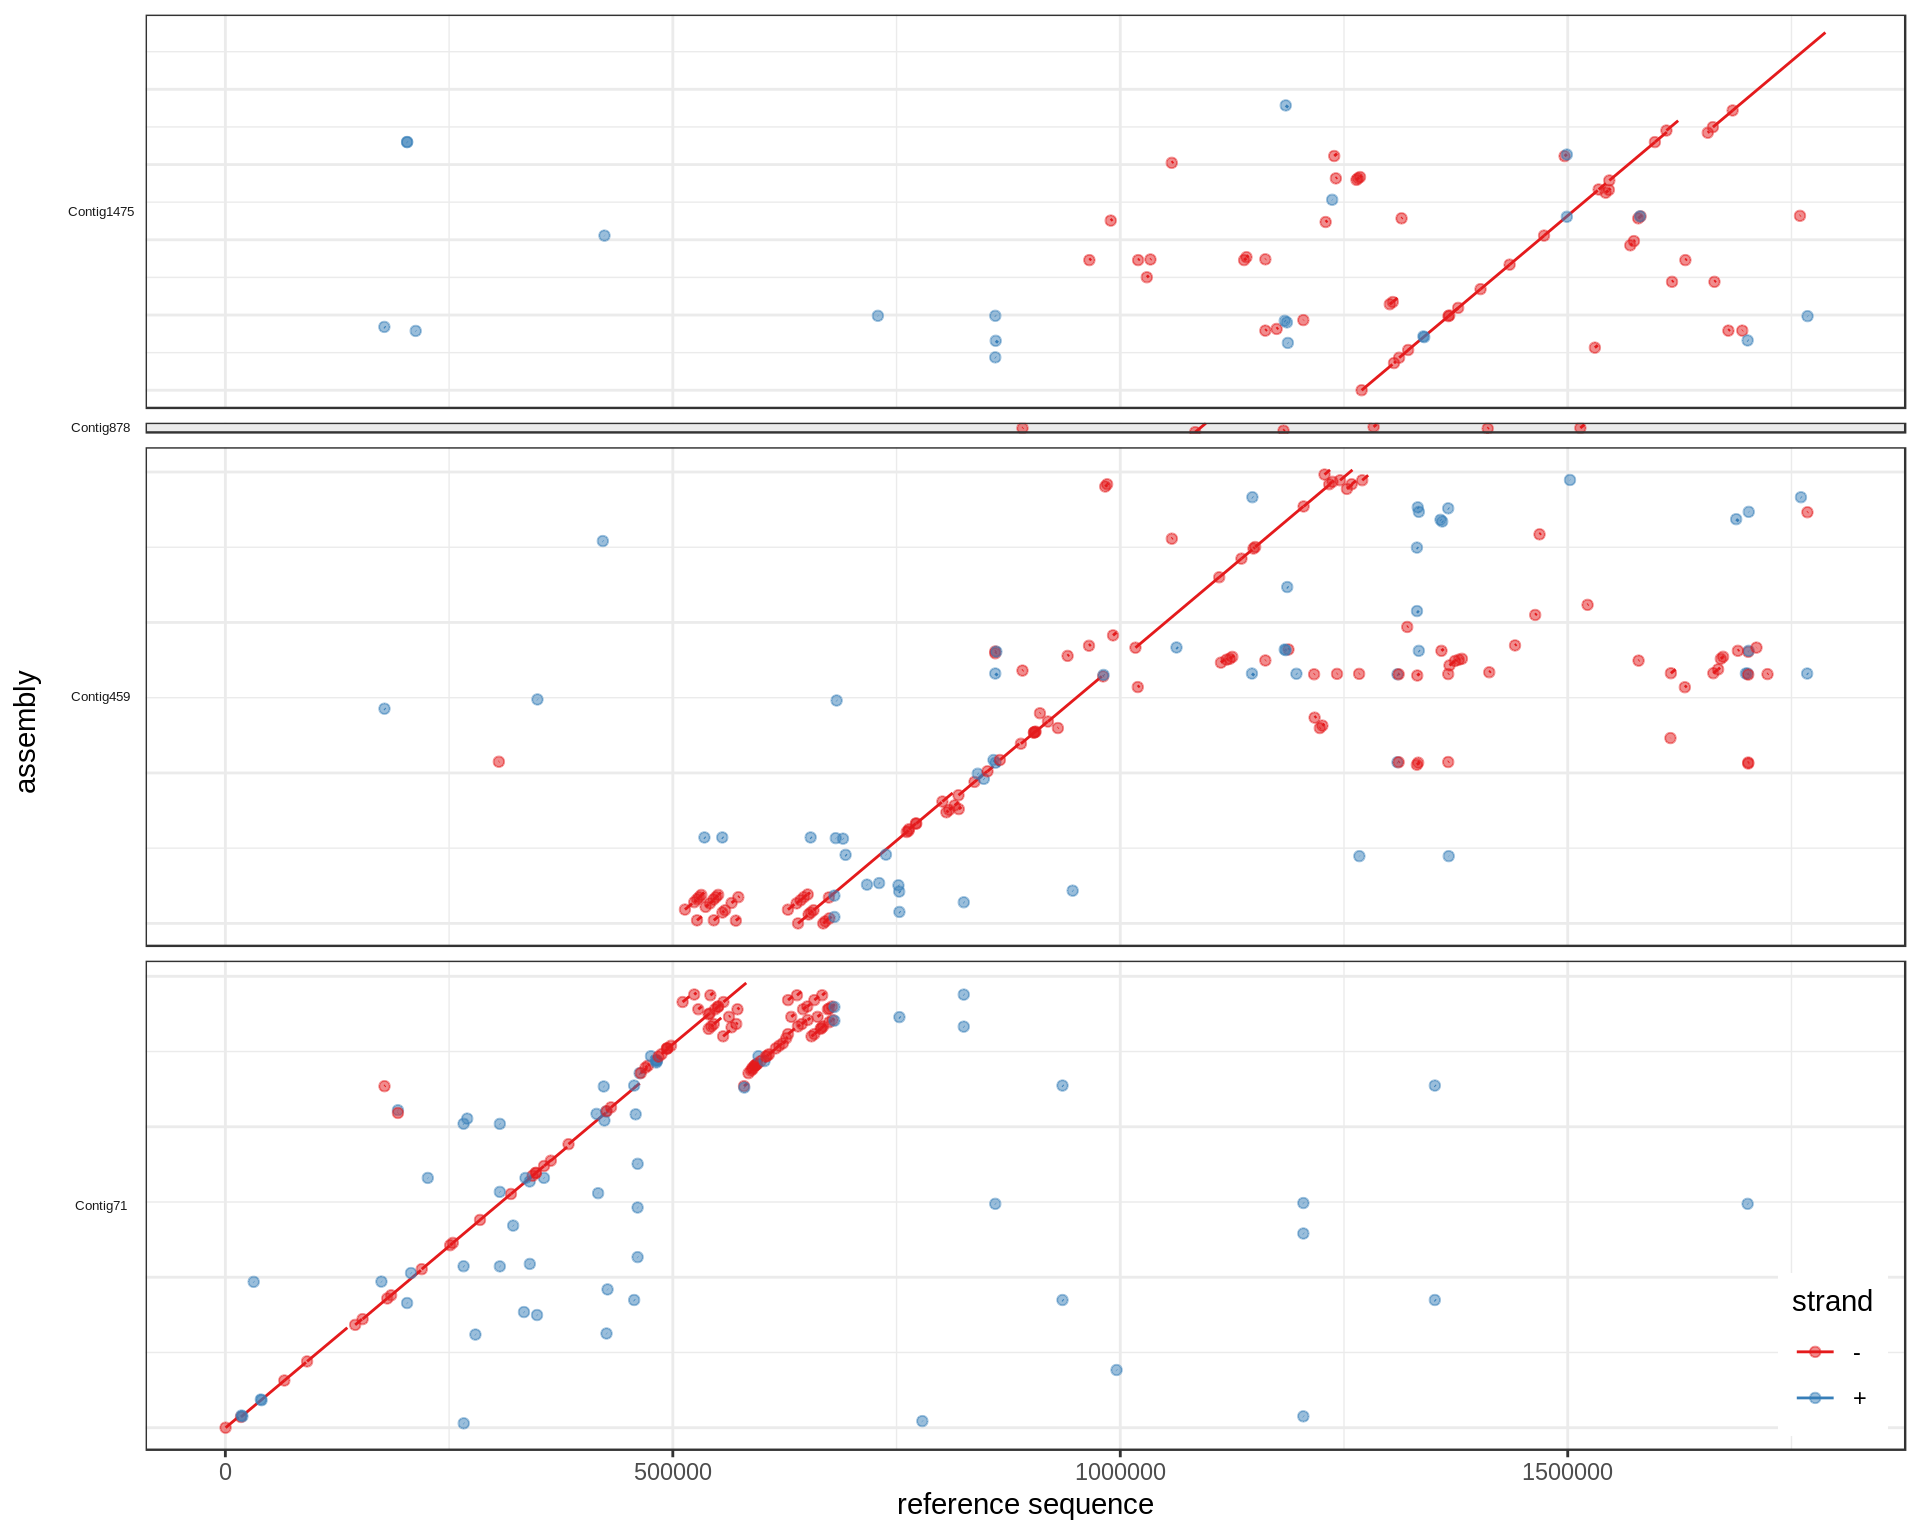
When a contig looks like it should be "flipped" (most bases aligned on - strand), the coordinates are transformed from qs to L-qs, where L is the length of the contig. For example, if an alignment block spans [80-90] of a 100bp contig, it would correspond to [10-20] of its reverse complemented sequence.
Of note, I didn't have the contig length easily accessible in that function, so I ended up using the maximum value of all the qe/qs instead. Not exactly ideal but fine for visualization purpose, esp. as those graphs don't have numbers on the y-axis.
I am using your code from here:
https://jmonlong.github.io/Hippocamplus/2017/09/19/mummerplots-with-ggplot2/
After using your function diagMum() the values of qs and qe are changing
For example, by writing only the first 6 columns, I have this before diagMum()
And, I have this after diagMum
Sorry if the answer is simple, but I don't understand what the function is doing and why the coordinates in the query are changing,
Many thanks.