You might want to try adding -Djmxtrans.agent.premain.waitForCustomMBeanServer=true to your JAVA_OPTS. For explanation see: https://github.com/jmxtrans/jmxtrans-agent#delayed-startup-version--121
Does that help?
Open fwelland opened 6 years ago
You might want to try adding -Djmxtrans.agent.premain.waitForCustomMBeanServer=true to your JAVA_OPTS. For explanation see: https://github.com/jmxtrans/jmxtrans-agent#delayed-startup-version--121
Does that help?
If you're not using the latest SNAPSHOT you might need to use -Djmxtrans.agent.premain.delay=30 instead
I can try both or either. Results pending.
Concerned that may not affect anything as when I turned on diagnostic trace the first 30 sec dump of
ManagementFactory.getPlatformMBeanServer().queryMBeans(null, null) didn't dump in JMX roots other than the java.lang stuff.
HOWEVER the 2nd and subsequent dumps listed the java.lang. stuff as well as some jboss and wildfly stuff (not listed in first dump). However the mbean root of the jboss AS stuff 'jboss.as.*' is not present in the diagnostic trace nor does it every seem to appear..
Jboss sets a system property programmatically in its startup sequence that controls the implementation of platform mbean server to use to be something jboss-specific. If jmxtrans initializes the platform mbean server before jboss modules sets that system property in its startup sequence, the mbean server jboss expects is not used. At best that will probably cause undefined/surprising behavior, so maybe that explains those symptoms.
+1
You are totally, correct! I am on jmxtrans-agent-1.2.8-SNAPSHOT.jar.
The diagnostic trace, (w/o waitForCustomMBeanServer) would should 'more' root mbean names on the 2nd and subsquent dumps; but never the roots 'jboss.as or jboss.as.expr'; and thus no stats.
Adding in waitForCustomMBeanServer=true caused the 2nd diagnostic trace to start dumping a ton more stuff, including the root 'jboss.as.*' and stats seemed to be showing up now.
FURTHER, JMC, with JMXTrans-agent active, will display the mbeans too!
Thanks for pointing this out!!!!
Awesome! :-) Glad to hear.
@fwelland @alechenninger 1.2.8-beta-1 cut today https://github.com/jmxtrans/jmxtrans-agent/releases/tag/jmxtrans-agent-1.2.8-beta-1
Hi all . can someone help me to find all the Objectnames and attributes that I can use for jboss? Thank you! just like the above bjectName="jboss.as.datasources.OracleDS.pool" attribute="ActiveCount" resultAlias="Active.Pool.Count
@rjhontiveros I like to use the "MBeans Browser" plugin of VisualVM to discover the MBeans of a server or of an application. https://visualvm.github.io/plugins.html

Hi @cyrille-leclerc ,
I used the visualvm but it only showing one mbeans.

here is my run.conf -Dcom.sun.management.jmxremote -Dcom.sun.management.jmxremote.port=9000 -Dcom.sun.management.jmxremote.authenticate=false -Dcom.sun.management.jmxremote.ssl=false -Djava.rmi.server.hostname=hostname.
I'm having error when I'm using this. JAVA_OPTS="$JAVA_OPTS -Djboss.platform.mbeanserver"
By the way I'm using jboss 5.1.0 . Thank you!
@rjhontiveros from what I remember, JBoss used to use a second MBean server with its own mbeans.
Many years ago, I used to use the following JSP page to introspect the MBeans from within the JVM: https://github.com/cyrille-leclerc/cyrille-leclerc/blob/master/src/main/webapp/tools/jmx/mbeans.jsp
I am kicking the tires on JMXTrans-agent and so far it works well for normal JVM stats collection (heap, threads, etc) monitoring for a JBOSS EAP 7.1.0 instance.
I have now tried to add in simple attribute data collection for a JBOSS datasource/pool. JBOSS seems configured correctly, as when I run JMC or VisualVM (local to jboss process) I can navigate to mbeans and interrogate attributes and so on. Here is the problem(s):
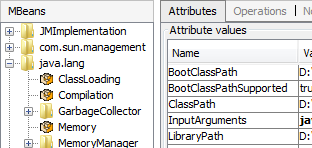
When I 'turn-on' JMXTrans-agent; all the jboss specific mbeans disappear from JMC/VisualVM; vanilla JVM level stuff is still there. Ok, no problem, maybe that is how JMXTrans-agent works: I'll turn it off, get the MBEAN names I need from JMC; put that in my jmxtrans-agent.xml and re-enable JMXTrans-agent.
Well that didn't work as JMXTrans-agent wasn't spitting out any data for the jboss mbeans. So I found this switch -Dorg.jmxtrans.agent.JmxTransAgent.diagnostic=true. I restarted with that in place and then I found out that ManagementFactory.getPlatformMBeanServer().queryMBeans(null, null) was not including the root mbeans I was interested in -- just like when using JMC/VisualVM couldn't see the mbeans while JMXTrans-agent was active.
It is like when I run JMXTrans-agent; all the jboss specific mbeans are gone!
Is there anything I can do about this?
NOTE: I have tried this same thing on jboss-eap 7.0.8 and jboss-eap-6.4.18 and they have same exact behavior. I haven't tried any of the wildflys yet; but EAP's 7x and Wildflys >8 are really really similar; I'd suspect Wildfly 10x and 11x to behave the same.
To turn-on JMXTrans-agent; I do:
My jmxtrans-agent.xml looks like: