joferkington / mplstereonet

Stereonets for matplotlib
MIT License
189 stars 66 forks source link

find_fisher_stats doesn't calculate fisher k or mean vector correctly for groups of poles which cross the dip=90 line #39

Open JNDanielson opened 3 years ago

JNDanielson commented 3 years ago

Hi Joe, The find_fisher_stats, fisher_stats, and mean_vector functions don't seem to be calculating Fisher k (kappa) or the mean vector of a group of poles correctly where the group of poles includes orientations which cross a dip=90°.

For example, the Fisher K and mean vector for this group of poles is correct. Calculated mean dip is 50°, Fisher K is 50. image
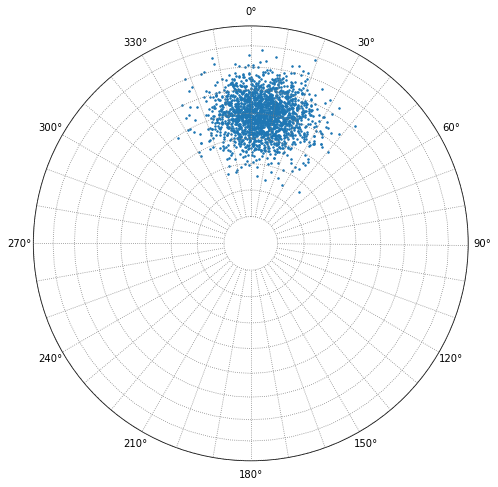
But, for this example the distribution has an actual Fisher k value of 25 and a mean dip of 85°, but the calculated kappa is 1.6 and the calculated mean dip is 62°. image
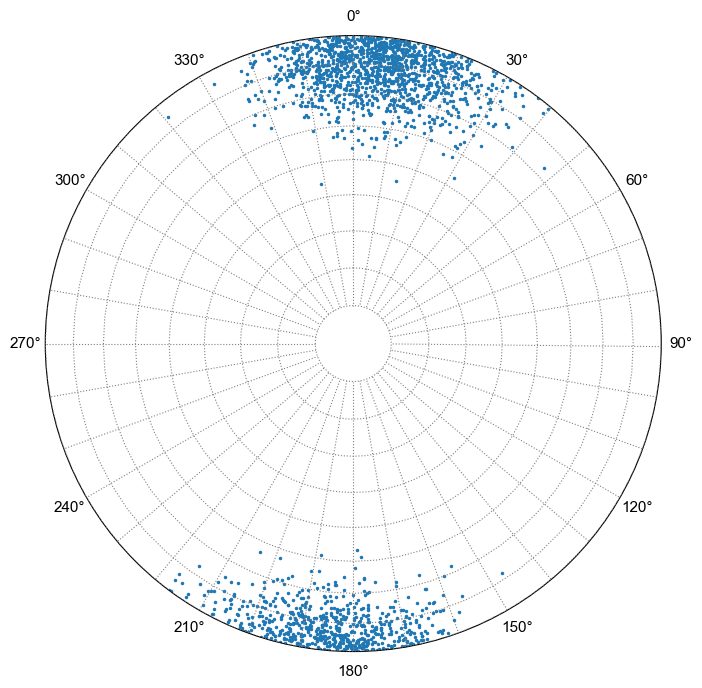
I think the issue is the lines of code where you take the mean of the vectors. xyz = np.vstack(xyz).T mean_vec = xyz.mean(axis=0)

When the largest eigenvalue flips direction, just taking the mean gives you a bad result. image
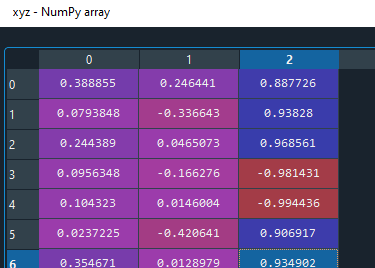
As a hack/workaround, I think you can do something like flip the normals so they all point in the same direction: le = np.argmax(np.max(np.abs(xyz), axis=0)) # largest eigenvalue is the one we should normalize the others by cond = xyz[:,le]<0 xyz = np.where(cond[:,None],xyz*-1,xyz)

But I bet you can come up with a better solution. This library is awesome, thanks for all your work on it!

JNDanielson commented 3 years ago

Ok, I figured out a better solution to figure out the mean vector mean_vec. This uses the scatter matrix approach from Directional Statistics (Jupp and Mardia, 2000, pp.165).

import scipy.linalg as la
import numpy as np

# strikes, dips are variables containing orientations for the distribution of poles
lons, lats = mpl.stereonet_math.pole(np.mod(strikes,360),(dips))
x, y, z = mpl.stereonet_math.sph2cart(lons, lats)

xyz = np.hstack((x,y,z))
xyz = np.array(xyz).T

# xbar is the sample mean vector. This won't be accurate for vectors that point in opposite directions.
xbar = xyz.mean(axis=1)

# xobar is the sample mean direction
Rbar = np.linalg.norm(xbar)
xobar = xbar/Rbar
xobar = xobar.reshape(3,1)

# n is number of poles in the distribution
n = xyz.shape[1]

# initialize the scatter matrix T
T = np.zeros((3,3))

# Equation 9.2.10 from Directional Statistics (Jupp and Mardia, 2000, pp.165)
for i in range(n):
    T += (xyz[:,i].reshape(3,1)).dot((xyz[:,i].reshape(3,1)).T)
T = T/n

# Mean vector of distribution is one of the eigenvectors of the scatter matrix T
eigs = la.eigh(T)
mean_vec = eigs[1][:,2]
mean_pole = mpl.stereonet_math.vector2pole(mean_vec[1],mean_vec[2],-1*mean_vec[0])

### print results to test
calculated_strike = mean_pole[0]
calculated_dip = mean_pole[1]
print(calculated_strike)
print(calculated_dip)
JNDanielson commented 3 years ago

I'll figure out how to make a pull request, but in the meantime here's a working update to the fisher_stats function that fixes the issues with mean orientation and kappa.

def fisher_stats(lons, lats, conf=95):
    """
    Returns the resultant vector from a series of longitudes and latitudes. If
    a confidence is set the function additionally returns the opening angle
    of the confidence small circle (Fisher, 19..) and the dispersion factor
    (kappa).

    Parameters
    ----------
    lons : array-like
        A sequence of longitudes (in radians)
    lats : array-like
        A sequence of latitudes (in radians)
    conf : confidence value
        The confidence used for the calculation (float). Defaults to None.

    Returns
    -------
    mean vector: tuple
        The point that lies in the center of a set of vectors.
        (Longitude, Latitude) in radians.

    If 1 vector is passed to the function it returns two None-values. For
    more than one vector the following 3 values are returned as a tuple:

    r_value: float
        The magnitude of the resultant vector (between 0 and 1) This represents
        the degree of clustering in the data.
    angle: float
        The opening angle of the small circle that corresponds to confidence
        of the calculated direction.
    kappa: float
        A measure for the amount of dispersion of a group of layers. For
        one vector the factor is undefined. Approaches infinity for nearly
        parallel vectors and zero for highly dispersed vectors.

    """
    xyz = sph2cart(lons, lats)
    xyz = np.vstack(xyz)

    # xbar is the sample mean vector
    xbar = xyz.mean(axis=1)

    # xobar is the sample mean direction
    r_value = np.linalg.norm(xbar)
    xobar = xbar/r_value
    xobar = xobar.reshape(3,1)
    num = xyz.shape[1]

    # Equation 9.2.10 from Directional Statistics (Jupp and Mardia, 2000, pp.165)
    T = np.zeros((3,3))
    for i in range(num):
        T += (xyz[:,i].reshape(3,1)).dot((xyz[:,i].reshape(3,1)).T)
    T = T/num

    # Mean vector of distribution is one of the eigenvectors of the scatter matrix T
    eigs = la.eigh(T)
    mean_vec = eigs[1][:,2]

    if num > 1:
        p = (100.0 - conf) / 100.0
        r_value = np.sqrt(eigs[0].max())
        vector_sum = mean_vec*num*r_value
        result_vect = np.sqrt(np.sum(np.square(vector_sum)))
        fract1 = (num - result_vect) / result_vect
        fract3 = 1.0 / (num - 1.0)
        angle = np.arccos(1 - fract1 * ((1 / p) ** fract3 - 1))
        angle = np.degrees(angle)
        kappa = (num - 1.0) / (num - result_vect)
        mean_vec = cart2sph(*mean_vec)
        return mean_vec, (r_value, angle, kappa)

    else:
        return None, None