Open johannes-fischer opened 3 years ago
I have tried starting julia with different numbers of threads and different AlphaZero parameters, no matter if I start julia -t 128 or julia -t 20, htop only shows a CPU utilization of around 1200% for this process, so only around 12 threads are working.
First of all, you should note that in some applications, there are legitimate reasons for the CPU utilization to be low. For example, if the main computational cost is to run inference and inference runs on GPU, having a high number of CPUs simply isn't useful as there just isn't enough work for them.
One way to figure out whether or not this is the case is to profile network inference and vanilla MCTS separately and compare the numbers. In your case, you seem to be using a very small network so I doubt inference would be the only bottleneck though. Also, if you are doing inference on CPU, note that the inference server is only going to use a single CPU because of this line, which you may want to try and comment out (restricting inference to one core is sometimes useful to avoid too much cache thrashing but it may backfire here).
Low CPU utilization may also be due (at least in part) to some GC or multitasking overhead. Indeed, even if you are not using a GPU (whose interaction with the Julia GC raises known issues), the Julia GC sometimes has problems at dealing with multiple threads that allocate a lot (this being worked on right now as far as I understand). Unfortunately, the current tools are not great for detecting and quantifying this kind of overhead.
When not using a GPU, are there benefits of batching inference requests at all? I.e. is it better to use multi-threading or multi-processing on one machine?
The benefits will certainly be greatly reduced but even a CPU can exploit some amount of parallelism so batching inference queries can be worth it, up to a point where the overhead of having many workers becomes too large (more allocations, more cache invalidation and context switching...)
I also remember seeing a plot of AlphaZero performance over the number of workers somewhere in the AlphaZero.jl documentation or some post you made (i think), but I cannot find it anymore. Do you happen to know which plot I'm referring to?
You may be referring to this figure, which I created for an old version and haven't regenerated since.
Multi-processing (without GPU):
The only interest of using multiple processes is if you want to leverage multiple GPUs (as CUDA.jl used to have very poor multi-gpu support) or distribute the computtion on a cluster of machines. Also, I believe that in recent versions Julia starts multiple threads by default unless you pass the -t 1
option explicitly.
Using GPU:
The network you are using is so small that the overhead of transferring data to the GPU is probably much higher than doing inference on CPU so I am not surprised here.
As a general question, I was also wondering about why you removed the asynchronous MCTS version - is there simply no benefit because CPU power can also be used to parallelize over different MCTS tree instead of within the same tree?
I removed it for the sake of simplicity as I was refactoring the code and realized that in most applications, batching inference requests across game simulations is enough and does not lead to the exploration bias induced by the use of a virtual loss. I may reintroduce it at some point though as using it in combination with parallel simulation workers may lead to significant performance improvements in some applications (by reducing the numbers of MCTS trees that are to be kept in memory simultaneously or enabling even bigger batches).
My more general advice for you is to start by running a lot of small profiling experiments: how much does it cost to simulate a step in my environment? How much does it cost to evaluate a batch using the CPU/GPU. What is the ideal batch size for my config?
Once you've done this, you can get a back-of-the-envelope estimate for the ideal performances you should expect from the full training loop, assuming no GC/multitasking overhead. Then, you can compare this number to the actual performances you are currently getting and only then work on reducing the gap.
Thank you for the detailed answer, this is much appreciated!
One way to figure out whether or not this is the case is to profile network inference and vanilla MCTS separately and compare the numbers.
Alright, I will do some profiling to get a better feeling for that.
You may be referring to this figure, which I created for an old version and haven't regenerated since.
Yes, that's what I was looking for! Thanks, even though this is probably not relevant anymore then.
The only interest of using multiple processes is if you want to leverage multiple GPUs (as CUDA.jl used to have very poor multi-gpu support) or distribute the computtion on a cluster of machines.
Conceptually, I understand this and agree. However, I'm wondering if it could still be useful is this case since multi-threading seems to not fully utilize resources and batching inferences seems less valuable when not using a GPU. I will do more experiments to see which configuration of threads and processes is fastest.
My more general advice for you is to start by running a lot of small profiling experiments: how much does it cost to simulate a step in my environment? How much does it cost to evaluate a batch using the CPU/GPU. What is the ideal batch size for my config?
Thanks, I will do that!
Hi,
Interesting topic.
I have been doing training purely on CPU machines. No changes to the AlphaZero code with the exception of use_gpu set to false in parameters file. My observations:
I have been able to achieve significantly (~ order of magnitude) shorter times when using multiple workers (distributed) and threads than only multiple threads. I mean, I have seen no point in using only multiple threads - "Self play" was very slow in such a case.
Until Iteration 9 I was able to train on a machine with 192GB RAM (24 OCPUs) with average calculation time per 1 iteration of ~15.5h then I had to switch to a machine with more RAM.
On 64 OCPUs and 384GB RAM calculation time for Iteration 10 and 11 increased to ~22h. I have seen slightly shorter time (~10% shorter) when using all 64 online CPUs than only on 32 Physical Cores. The highest RAM utilization I saw during Iteration 11 was about 320GB.
I have seen full utilization of all cores only at the first part of the first step ("Self play"). For later stages in case of 24 OCPU's the observed utilization was about ~20% and about ~8% in case of 64 OCPUs.
I found the following question asked by johannes-fischer particularly interesting:
Furthermore, it is 8 threads that are working at full load (the ones from julia -p 20 call, not 20, which would be the number of processes). So where does that number 8 come from?
Would it be possible to receive additional information on this topic please?
Best regards!
Edit: some typos
It is interesting and surprising that using several processes is so much faster than using several threads. A possible advantage of processes over threads is that they each have their own GC and so each process can collect its garbage without stopping the world (this should be improved in the future). But could this explain an order of magnitude difference? I feel like I am missing something here and I would like to understand this better.
Also, @idevcde: this sounds like you observed a significant slowdown during training. Is it possible that the system was simply using too much memory and ended up spending too much time fetching pages from the swap? Did you look at the ratio of time spent in GC in the generated report?
More generally, I must admit that AlphaZero.jl could be more efficient in the way it handles memory (using async MCTS to diminish the number of MCTS trees to maintain without diminishing batch size, MCTS implementation without state sharing, storing samples on disk...). That being said, I've had several reports of increasing memory consumption during training to an extent that I find surprising. I do not see how AlphaZero.jl could be leaking memory (as there is very little shared state between iterations) and so I would like more data on this. May the GC be at fault once again?
What also confused me is that even even when calling single-threaded julia -p 64, htop shows multiple threads belonging to the main process during benchmarking (where AlphaZero does not use multi-processing). This is not problematic, I'm just trying to understand what's happening. I don't see how Util.mapreduce spawns multiple threads since Threads.nthreads() should be 1. Furthermore, it is 8 threads that are working at full load (the ones from julia -p 20 call, not 20, which would be the number of processes). So where does that number 8 come from?
Could it be BLAS spawning 8 threads to perform the linear algebra during inference? The number 8 also appears here: https://github.com/JuliaLang/julia/issues/33409.
Thank you.
It is interesting and surprising that using several processes is so much faster than using several threads.
I have to admit that I am surprised as well. I was expecting multithreading being faster.
But could this explain an order of magnitude difference?
I just checked the notes and unfortunately it seems that I do not have any notes on those stopped pure multithreading trainings. I think that the fist step ("Self play") was about 5-10 times slower vs Distributed training with the number 10 being closer to my judgement.
I feel like I am missing something here and I would like to understand this better.
I do training using the following code:
using Distributed addprocs(64) @everywhere using AlphaZero @everywhere experiment = Examples.experiments["connect-four"] session = Session(experiment, dir="/home/xxxxxx/data/JuliaCon21/AlphaZero.jl/mytrainings/sessions/connect-four") resume!(session)
Julia 1.6.1. and Julia 1.7 beta3, AlphaZero, MKL and LinearAlgebra as the only additional Julia packages installed. No changes to the code, with exception of gpu set to false. All successful trainings with libopenblas64_.so. (or at last for 1.7 beta3 as I was not checking it for 1.6.1 so no MKL, however, my guess is that it was the same).
Also, @idevcde: this sounds like you observed a significant slowdown during training.
I guess you are referring to multithread trainings. Because as for Distributed, I have to admit that I am pretty happy with the times on CPU only machine, especially for the first step (Self play) which took 3:48:29 at Iteration 11.
Is it possible that the system was simply using too much memory and ended up spending too much time fetching pages from the swap? Did you look at the ratio of time spent in GC in the generated report?
Unfortunately I did not. I will try to further investigate the topic of swap/GC and will also try to consult with some of my colleagues. Should I be able to provide additional information I will do it here.
I do not see how AlphaZero.jl could be leaking memory [...]
According to the best of my knowledge there are no memory leaks. However, please be advised that I am not an ultra experienced developer.
Could it be BLAS spawning 8 threads to perform the linear algebra during inference? The number 8 also appears here: JuliaLang/julia#33409.
Thank you. As for the BLAS, somehow, the previous link provided by you seemed not to work and it was not readable upfront. I will try to investigate this topic further when time permits.
As for the BLAS, I have one additional question. I am also wondering if the use of MKL library might bring any benefit?
Iteration 1-9 I trained on Julia 1.6.1. with libopenblas64_.so. Iteration 10 and 11 on Julia 1.7 beta 3 which I understand brings native support for libmkl_rt.so when using MKL package. In general on simple matrix multiplication I saw about 30% decrease of calculation time on one of the machines (I think it was Intel Xeon Gold 6128 CPU @ 3.40GHz) when using libmklrt.so vs libopenblas64.so. However, when trying to launch AZ training with MKL I received the following error:
OMP: Error #34: System unable to allocate necessary resources for OMP thread: OMP: System error #11: Resource temporarily unavailable OMP: Hint: Try decreasing the value of OMP_NUM_THREADS.
signal (6): Aborted in expression starting at /home/xxxxxx/data/JuliaCon21/AlphaZero.jl/mytrainings/mytraining1.jl:84 gsignal at /lib/x86_64-linux-gnu/libc.so.6 (unknown line) abort at /lib/x86_64-linux-gnu/libc.so.6 (unknown line) kmp_abort_process at /home/xxxxxx/.julia/artifacts/947793e42b663bacd09f00d96aa96a47095f3b1c/lib/libiomp5.so (unknown line) kmp_fatal at /home/xxxxxx/.julia/artifacts/947793e42b663bacd09f00d96aa96a47095f3b1c/lib/libiomp5.so (unknown line) kmp_create_worker at /home/xxxxxx/.julia/artifacts/947793e42b663bacd09f00d96aa96a47095f3b1c/lib/libiomp5.so (unknown line) kmp_allocate_thread at /home/xxxxxx/.julia/artifacts/947793e42b663bacd09f00d96aa96a47095f3b1c/lib/libiomp5.so (unknown line) kmp_allocate_team at /home/xxxxxx/.julia/artifacts/947793e42b663bacd09f00d96aa96a47095f3b1c/lib/libiomp5.so (unknown line) kmp_fork_call at /home/xxxxxx/.julia/artifacts/947793e42b663bacd09f00d96aa96a47095f3b1c/lib/libiomp5.so (unknown line) __kmpc_fork_call at /home/xxxxxx/.julia/artifacts/947793e42b663bacd09f00d96aa96a47095f3b1c/lib/libiomp5.so (unknown line) omp_simple_3d at /home/xxxxxx/.julia/artifacts/a8e009985328801a84c9af6610f94f77a7c12852/lib/libmkl_intel_thread.so.1 (unknown line) gemm_omp_driver_v2 at /home/xxxxxx/.julia/artifacts/a8e009985328801a84c9af6610f94f77a7c12852/lib/libmkl_intel_thread.so.1 (unknown line) mkl_blas_sgemm at /home/xxxxxx/.julia/artifacts/a8e009985328801a84c9af6610f94f77a7c12852/lib/libmkl_intel_thread.so.1 (unknown line) sgemm at /home/xxxxxx/.julia/artifacts/a8e009985328801a84c9af6610f94f77a7c12852/lib/libmkl_intel_ilp64.so.1 (unknown line) sgemm at /home/xxxxxx/.julia/artifacts/a8e009985328801a84c9af6610f94f77a7c12852/lib/libmkl_rt.so (unknown line) gemm! at /home/xxxxxx/.julia/packages/NNlib/CSWJa/src/gemm.jl:51 [inlined] macro expansion at /home/xxxxxx/.julia/packages/NNlib/CSWJa/src/impl/conv_im2col.jl:58 [inlined]
unknown function (ip: 0x7fb7e417cf05) _jl_invoke at /buildworker/worker/package_linux64/build/src/gf.c:2245 [inlined] jl_apply_generic at /buildworker/worker/package_linux64/build/src/gf.c:2427 jl_apply at /buildworker/worker/package_linux64/build/src/julia.h:1787 [inlined] jl_f__call_latest at /buildworker/worker/package_linux64/build/src/builtins.c:757
invokelatest at ./essentials.jl:714 [inlined] macro expansion at ./threadingconstructs.jl:90 [inlined]
conv_im2col! at /home/xxxxxx/.julia/packages/NNlib/CSWJa/src/impl/conv_im2col.jl:30 [inlined]
unknown function (ip: 0x7fb7e417b562) _jl_invoke at /buildworker/worker/package_linux64/build/src/gf.c:2245 [inlined] jl_apply_generic at /buildworker/worker/package_linux64/build/src/gf.c:2427 jl_apply at /buildworker/worker/package_linux64/build/src/julia.h:1787 [inlined] start_task at /buildworker/worker/package_linux64/build/src/task.c:878 Allocations: 221650728 (Pool: 221595669; Big: 55059); GC: 83 /var/spool/torque/mom_priv/jobs/"jobnumber.server": line 19: 22711 Aborted (core dumped) julia -t 64 mytraining1.jl
I did the MKL test without using Distributed. AlphaZero, MKL as the only additional Julia packages installed. The code as follow:
using MKL using LinearAlgebra BLAS.get_config() using AlphaZero experiment = Examples.experiments["connect-four"] session = Session(experiment, dir="/home/xxxxxx/data/JuliaCon21/AlphaZero.jl/mytrainings/sessions/connect-four") resume!(session)
Do you have any opinion? And additional advice or comment on this topic/s?
Best regards!
Edit: removed "and LinearAlgebra". Was: "AlphaZero, MKL and LinearAlgebra as the only additional Julia packages installed." Is: "AlphaZero, MKL as the only additional Julia packages installed."
I have been able to achieve significantly (~ order of magnitude) shorter times when using multiple workers (distributed) and threads than only multiple threads.
@idevcde thanks for your insights, could you provide some more information on how many workers and threads you were using depending on the number of available CPUs to achieve best results?
Did you look at the ratio of time spent in GC in the generated report?
@jonathan-laurent I had a look at some of the performance plots and it seems that GC in multi-processing is very small, but for only multi-threading is at around 40% of self-play (I didn't use both at the same time yet). In one multi-processing run GC jumped from 5% to 30% at iteration 28, though. I don't know, if swapping became necessary at this point.
@johannes-fischer Thanks! This seems to indicate that a lot of the overhead we're seeing here comes from the GC not performing great with multiple heavily allocating threads.
I am not sure the performance drop you are seeing has anything to do with swapping as I would expect swapping to slow down the program uniformly, but it is not the first weird GC behavior I have been observing.
@johannes-fischer
thanks for your insights, could you provide some more information on how many workers and threads you were using depending on the number of available CPUs to achieve best results?
I am not sure if those are the absolute best possible results. Please be advised that I am new to this topic. However, I have tried more than a few different combinations. I am providing additional info.
My observations are related to 11 iterations. In general I have used mostly two machines (please see below) with default settings of AlphaZero v0.5.1. (the only change being gpu set to false in the parameters file). I used two versions of Julia (1.6.1 and 1.7.0-beta3.0). It was run on Ubuntu 20.04.3 LTS (Focal Fossa).
The conclusions are based on free observations, which means I have not done any statistical calculations and that there might be some slight additional deviations to the ones I listed above which I am not covering in detail. For example, I might have used for any particular training a gpu set to true on a CPU only machine or a slightly different version of Ubuntu or a very slightly different version of AlphaZero. However, this would be rather a very rare situation.
One machine I used is Intel(R) Xeon(R) Gold 6128 CPU @ 3.40GHz with 192GB RAM (this is 6 physical cores per socket with 2 sockets which means 12 physical and 24 logical cores). The other one is Intel(R) Xeon(R) Platinum 8153 CPU @ 2.00GHz with 384GB RAM (this is 16 physical cores per socket with 2 sockets which means 32 physical and 64 logical cores). All the findings are related to those two machines.
I have also tried Intel(R) Core(TM) i9-10920X CPU @ 3.50GHz with 32GB RAM and Intel(R) Xeon(R) E-2176G CPU @ 3.70GHz with 64GB RAM. However, due to the limited RAM footprint my trainings crashed very shortly or quite shortly after the start.
I think that I achieved the best results in terms of computational time per iteration when using maximum number of available logical threads and maximum number of available logical distributed workers. I would say that using distributed workers run only on physical cores and at the same time using threads run only on physical cores is increasing computational time by more or less 10%. In addition I would say that using only distributed workers (no matter if they are run only on physical or on all logical cores) and not using threads at all is increasing computational time by additional 10%. As I wrote in my previous post, I would say that using only all available logical threads and not using distributed workers at all, makes the first part of the training (Self play) very slow, like 10 times slower. Moreover, as I wrote earlier, I saw full utilization of CPU (observed in "top -H" on Linux) only during the first part of the training (Self play). During later stages, I saw only about 8 workers mostly fully utilized and additional few (like additional 2 to 4) utilized at 5 to 25% from time to time). As I wrote earlier, I was able to run iteration 1 to 9 (average calculation time per 1 iteration was about 15.5h) on the first machine with 192GB RAM. Than I had to use a machine with more RAM as 192GB was insufficient. During iteration 11 on the second machine with 384GB RAM, the highest RAM utilization I spotted was about 320GB. Average calculation time for iteration 10 and 11 was about 22h (maybe slightly less, as in those cases I was not able to get very precise timings as calculations for next iteration started before I sent a break commands). At iteration 11 [julia -t 64 mytraining1.jl / using Distributed and addprocs(64)] I see the following results:
Starting iteration 11
Starting self-play
Progress: 100%|█████████████████████████████████████| Time: 3:48:29
Generating 12 samples per second on average
Average exploration depth: 9.4
MCTS memory footprint per worker: 6.02MB
Experience buffer size: 800,000 (346,387 distinct boards)
Starting learning
Optimizing the loss
Loss Lv Lp Lreg Linv Hp Hpnet
0.3465 0.0973 0.1467 0.1022 0.0001 0.6879 0.8369
0.3468 0.1010 0.1451 0.1004 0.0002 0.6879 0.8392
Launching a checkpoint evaluation
Progress: 100%|███████████████████████████████████| Time: 6:31:51
Average reward: +0.41 (58% won, 26% draw, 16% lost, network replaced), redundancy: 51.7%
Running benchmark: AlphaZero against MCTS (1000 rollouts)
Progress: 100%|█████████████████████████████████████| Time: 3:37:14
Average reward: +0.99 (100% won, 0% draw, 0% lost), redundancy: 29.0%
Running benchmark: Network Only against MCTS (1000 rollouts)
Progress: 100%|█████████████████████████████████████| Time: 0:01:14
Average reward: +0.88 (93% won, 1% draw, 5% lost), redundancy: 26.4%
@jonathan-laurent, @johannes-fischer Should you have any comments or any advise please let me know. Also do you think that trying to further investigate MKL.jl package that I mentioned earlier might be a good idea? I have also read about Octavian.jl. Does it make sense to investigate those kind of packages at all?
I think that I achieved the best results in terms of computational time per iteration when using maximum number of available logical threads and maximum number of available logical distributed workers.
@idevcde Thanks! So to make that explicit, on the machine with 64 logical cores you used julia with 64 worker processes and each of them used 64 threads?
@idevcde Thanks for those details! I do not think it would be very useful to experiment with MKL.jl or Octavian.jl as I am pretty sure the performance problems do not come from whatever linear algebra library is used.
The one thing you can try is comment out the following line in the src/AlphaZero.jl
:
LinearAlgebra.BLAS.set_num_threads(1)
Apart from this, the gap in performance probably results from a combination of GC / multitasking overhead.
I think the inference might also play a major role in this. Currently, I'm running a training with only multi-threading (32 threads) and during running the MCTS only benchmark with RolloutOracle the CPU utilization is close to 3200%. But during self-play (and presumably also during AlphaZero benchmark) the CPU utilization drops to the previously reported levels.
@johannes-fischer So the question here is: if inference is the bottleneck, how can we make sure that a high number of cores is dedicated to inference? Here, there are two things you can do:
@johannes-fischer
Thanks! So to make that explicit, on the machine with 64 logical cores you used julia with 64 worker processes and each of them used 64 threads?
Thanks! This I can not confirm. I wrote above that I did various experiments and I presented most of my findings above. As you can see results of iteration 11 presented above, for this particular run, I started Julia with 64 threads and than added 64 distributed worker processes. I do not understand in full the code inside AlphaZero.jl and I do not understand in detail what is going on under the hood.
@jonathan-laurent
The one thing you can try is comment out the following line in the src/AlphaZero.jl: LinearAlgebra.BLAS.set_num_threads(1)
Thanks! I will do the test ASAP, however, it may not be immediately.
The current BLAS config may force the inference server to use one core only, leading to slowdowns. Also, on second thoughts, investigating MKL.jl and Octavian.jl as suggested by @idevcde may actually not be a bad idea if it enables leveraging more cores (although I am pretty sure BLAS could be configured properly here).
Can I ask, out of the whole AlphaZero calculations, what percentage on average is linear algebra? Does it significantly differ among particular stages (self-play, learning, benchmark: AlphaZero against MCTS, benchmark: Network Only against MCTS)?
If you look at the chart located at https://github.com/JuliaLinearAlgebra/Octavian.jl [https://raw.githubusercontent.com/JuliaLinearAlgebra/Octavian.jl/master/docs/src/assets/bench10980xe.svg] which side is more relevant to AlphaZero; left or right or maybe AlphaZero is out of this chart?
Edit: attached bench10980xe chart
I started Julia with 64 threads and than added 64 distributed worker processes.
Thanks, afaik in this case only the main process has 64 threads whereas the workers are only single threaded (unless you use addprocs()
with exeflags
argument to specify the number of threads or start julia -p 64 -t 64
). Since threads cannot be added at runtime, also AlphaZero code won't be able to change that.
@johannes-fischer Thanks. This is a new information for me. I will check your suggestion when ... time permits.
@jonathan-laurent
Did you look at the ratio of time spent in GC in the generated report?
Did you have those ratios on your mind (report.json)? Please be advised that there were sometimes slightly different settings as I indicated above. All computations for iteration 1 to 9 on Intel(R) Xeon(R) Gold 6128 CPU @ 3.40GHz (2 sockets) with 192GB RAM, Julia 1.6.1., AlphaZero v0.5.0, [ILP64] libopenblas64.so. All computations for iteration 10 and 11 on Intel(R) Xeon(R) Platinum 8153 CPU @ 2.00GHz with 384GB RAM (2 sockets), Julia Version 1.7.0-beta3.0 (2021-07-07), AlphaZero v0.5.1 or v0.5.0 (to be confirmed), [ILP64] libopenblas64.so.
<html xmlns:v="urn:schemas-microsoft-com:vml" xmlns:o="urn:schemas-microsoft-com:office:office" xmlns:x="urn:schemas-microsoft-com:office:excel" xmlns="http://www.w3.org/TR/REC-html40">
Iteration | 1 | 2 | 3 | 4 | 5 | 6 | 7 | 8 | 9 | 10 | 11 -- | -- | -- | -- | -- | -- | -- | -- | -- | -- | -- | -- Duration (h m s) | 14:18:43 | 12:37:41 | 14:58:54 | 15:56:05 | 16:18:05 | 17:18:30 | 15:37:34 | 15:27:55 | 15:38:36 | ~22:38:38 (this includes Iteration 11 (next iteration) self play up to 1%) | ~21:55:15 (this includes Iteration 12 (next iteration) self play started and being at 0%) | "perfs_self_play" | "perfs_self_play" | "perfs_self_play" | "perfs_self_play" | "perfs_self_play" | "perfs_self_play" | "perfs_self_play" | "perfs_self_play" | "perfs_self_play" | "perfs_self_play" | "perfs_self_play" "gc_time"/"time" | 0.000027 | 0.000071 | 0.00026559 | 0.000467688 | 0.001762176 | 0.003331976 | 0.000254448 | 0.000945091 | 0.000749243 | 0.001182 | 0.005342819 | | | | | | | | | | | | "perfs_memory_analysis" | "perfs_memory_analysis" | "perfs_memory_analysis" | "perfs_memory_analysis" | "perfs_memory_analysis" | "perfs_memory_analysis" | "perfs_memory_analysis" | "perfs_memory_analysis" | "perfs_memory_analysis" | "perfs_memory_analysis" | "perfs_memory_analysis" "gc_time" | 0 | 0 | 0 | 0 | 0 | 0 | 0 | 0 | 0 | 0 | 0 | | | | | | | | | | | | "perfs_learning" | "perfs_learning" | "perfs_learning" | "perfs_learning" | "perfs_learning" | "perfs_learning" | "perfs_learning" | "perfs_learning" | "perfs_learning" | "perfs_learning" | "perfs_learning" "gc_time"/"time" | 0.015199525 | 0.011169273 | 0.009918299 | 0.009652197 | 0.007352897 | 0.021725253 | 0.006199996 | 0.009827222 | 0.009977426 | 0.008390326 | 0.011541601
Hi,
I'm currently trying to get AlphaZero running in full parallelization, but I'm having issues at all levels of parallelization. I'm new to parallelization, so I might also have misunderstood some parts. I'm running it on a machine with 128 CPUS, but I cannot achieve a very high CPU utilization, no matter if I try multi-threading or multi-processing.
Multi-threading (without GPU): I have tried starting julia with different numbers of threads and different AlphaZero parameters, no matter if I start
julia -t 128
orjulia -t 20
,htop
only shows a CPU utilization of around 1200% for this process, so only around 12 threads are working. I was wondering if that is due to them waiting for the inference server, but I got similar results when using a very small dummy network. Also,SimParams.num_workers
was 128 and batch size 64, so shouldn't other workers continue simulations while some are waiting for the inference server? If the inference is the reason, would I be better off with a small batch size or a large batch size? When not using a GPU, are there benefits of batching inference requests at all? I.e. is it better to use multi-threading or multi-processing on one machine? I also remember seeing a plot of AlphaZero performance over the number of workers somewhere in the AlphaZero.jl documentation or some post you made (i think), but I cannot find it anymore. Do you happen to know which plot I'm referring to?Multi-processing (without GPU): When using multiple processes (on the same machine, e.g.
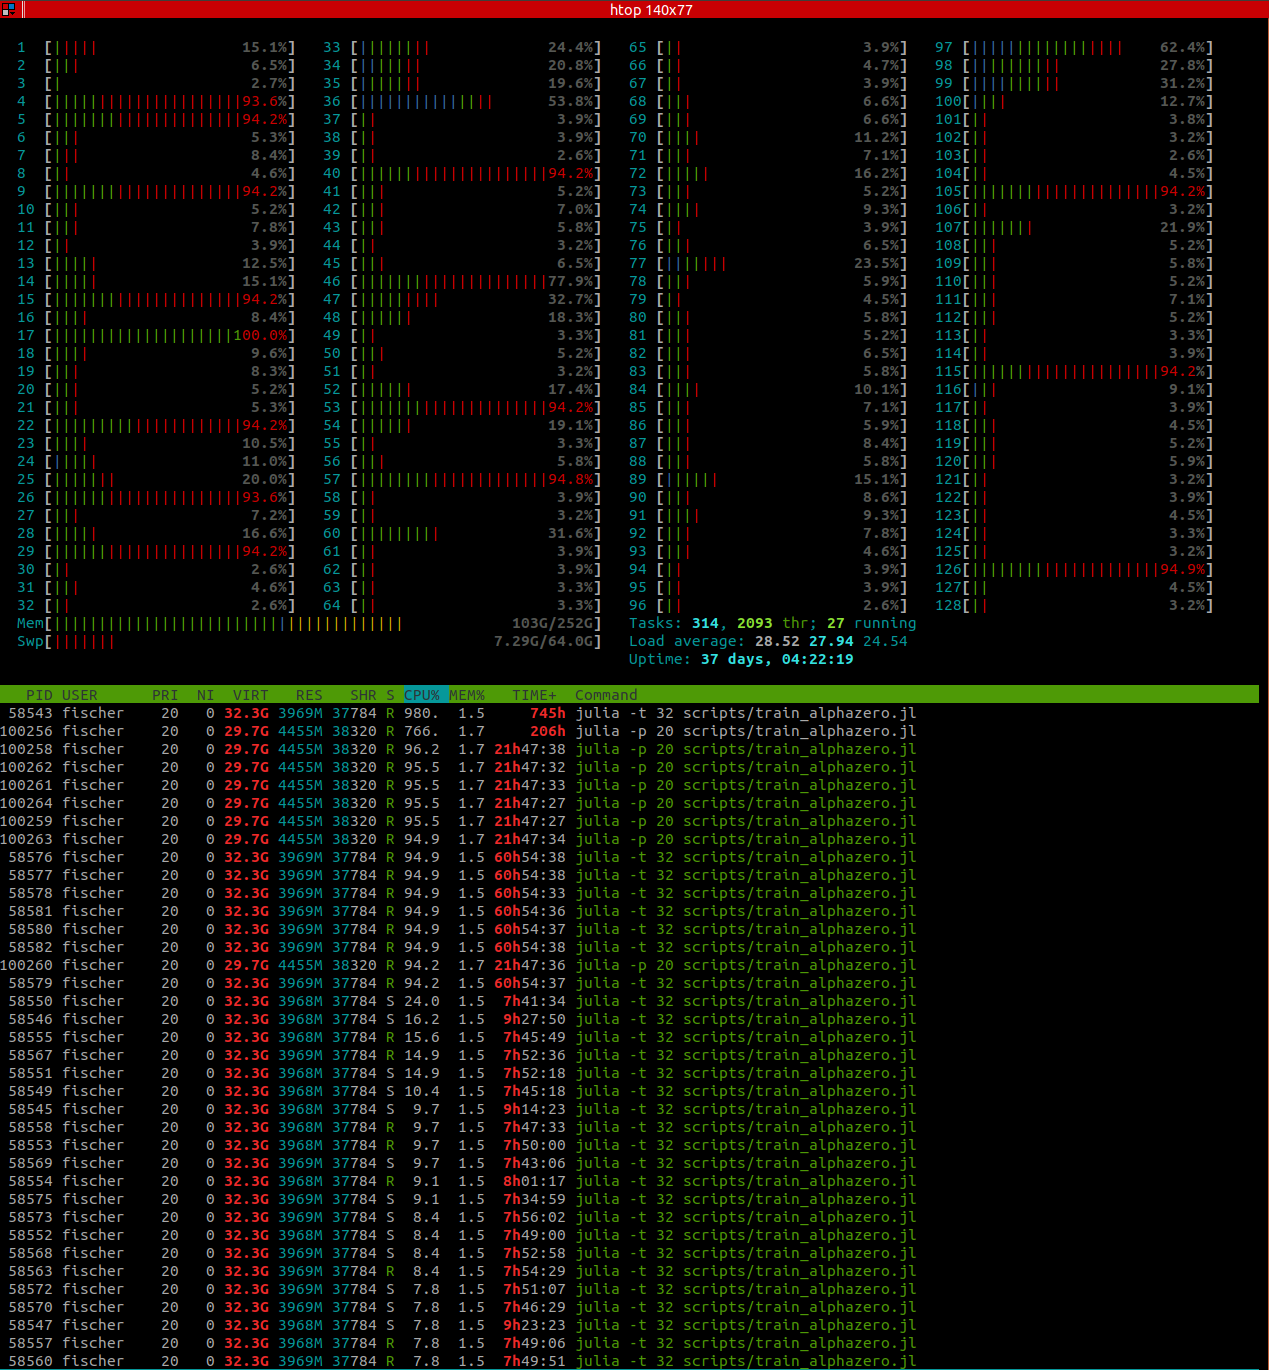
julia -p 64
),htop
shows all workers having a high CPU load during self-play. However, if I understand correctly, this is a waste of resources, since each process has to start its own inference server. Or is this better when not using a GPU? What also confused me is that even even when calling single-threadedjulia -p 64
,htop
shows multiple threads belonging to the main process during benchmarking (where AlphaZero does not use multi-processing). This is not problematic, I'm just trying to understand what's happening. I don't see how Util.mapreduce spawns multiple threads sinceThreads.nthreads()
should be 1. Furthermore, it is 8 threads that are working at full load (the ones fromjulia -p 20
call, not 20, which would be the number of processes). So where does that number 8 come from?Using GPU: When I try running AlphaZero.jl with GPU, for some reason it becomes incredibly slow, a lot slower than without GPU.
htop
now shows a CPU usage of around 500%: The machine has multiple GeForce RTX 2080 Ti with 10GB memory. Any ideas what could cause this?Here are the parameters I used, in case this is relevant:
(
PWMctsParams
are for a progressive widening MCTS I've implemented for continuous states)As a general question, I was also wondering about why you removed the asynchronous MCTS version - is there simply no benefit because CPU power can also be used to parallelize over different MCTS tree instead of within the same tree?
Any help is appreciated!