Open Alerinos opened 1 year ago
<Meta Property="og:type" Content="article" />
<Meta Property="og:title" Content="Articles" />
<Meta Property="og:description" Content="Articles description" />
<Meta Property="og:url" Content="https://localhost:44300/Articles" />
<Meta Property="og:site_name" Content="a" />
<Meta Property="og:image" Content="https://localhost:44300/images/ogp.png" />
<Meta Property="og:image:width" Content="1200" />
<Meta Property="og:image:height" Content="630" />
<Meta Property="og:locale" Content="en_US" />
<Meta Property="og:locale:alternate" Content="pl_PL" />
<Meta Property="twitter:card" Content="summary_large_image" />
<Meta Property="twitter:site" Content="a" />
<Meta Property="twitter:creator" Content="a" />
<Meta Property="twitter:title" Content="Articles" />
<Meta Property="twitter:description" Content="Articles description" />
<Meta Property="twitter:image" Content="https://localhost:44300/images/ogp.png" />
When using tags, it gets even worse.
Without the use of tags:
@Alerinos Thank you for reporting!
Unfortunately, I could not reproduce a performance issue on my side.
The project that I used to try to reproduce the issue is below: 📦PerformanceCheck.zip
That sample project responds 231 KB HTML content includes pre-rendered header element, but the time is under 70 ms on my Windows PC (Microsoft Surface Pro 8, Intel(R) Core(TM) i7-1185G7 3.00GHz).
Could you provide any advices to reproduce the issue on my side?
@jsakamoto
I opened your project
Visual Studio 17.4.0 Preview 2.0 Windows 11 AMD Ryzen 9 3900XT 12 core 4,10 GHz DDR4 32 GB 3200Mhz Drive Samsung 980 pro Read 7000 MB/s A very strange case
PM> dotnet --info
.NET SDK:
Version: 7.0.100-rc.1.22431.12
Commit: f1cf61e1c0
Ĺšrodowisko uruchomieniowe:
OS Name: Windows
OS Version: 10.0.22000
OS Platform: Windows
RID: win10-x64
Base Path: C:\Program Files\dotnet\sdk\7.0.100-rc.1.22431.12\
Host:
Version: 7.0.0-rc.1.22426.10
Architecture: x64
Commit: 06aceb7015
.NET SDKs installed:
6.0.400 [C:\Program Files\dotnet\sdk]
7.0.100-rc.1.22431.12 [C:\Program Files\dotnet\sdk]
.NET runtimes installed:
Microsoft.AspNetCore.All 2.1.30 [C:\Program Files\dotnet\shared\Microsoft.AspNetCore.All]
Microsoft.AspNetCore.App 2.1.30 [C:\Program Files\dotnet\shared\Microsoft.AspNetCore.App]
Microsoft.AspNetCore.App 3.1.28 [C:\Program Files\dotnet\shared\Microsoft.AspNetCore.App]
Microsoft.AspNetCore.App 6.0.8 [C:\Program Files\dotnet\shared\Microsoft.AspNetCore.App]
Microsoft.AspNetCore.App 7.0.0-rc.1.22427.2 [C:\Program Files\dotnet\shared\Microsoft.AspNetCore.App]
Microsoft.NETCore.App 2.1.30 [C:\Program Files\dotnet\shared\Microsoft.NETCore.App]
Microsoft.NETCore.App 3.1.28 [C:\Program Files\dotnet\shared\Microsoft.NETCore.App]
Microsoft.NETCore.App 6.0.8 [C:\Program Files\dotnet\shared\Microsoft.NETCore.App]
Microsoft.NETCore.App 7.0.0-rc.1.22426.10 [C:\Program Files\dotnet\shared\Microsoft.NETCore.App]
Microsoft.WindowsDesktop.App 3.1.28 [C:\Program Files\dotnet\shared\Microsoft.WindowsDesktop.App]
Microsoft.WindowsDesktop.App 6.0.8 [C:\Program Files\dotnet\shared\Microsoft.WindowsDesktop.App]
Microsoft.WindowsDesktop.App 7.0.0-rc.1.22427.1 [C:\Program Files\dotnet\shared\Microsoft.WindowsDesktop.App]
Other architectures found:
x86 [C:\Program Files (x86)\dotnet]
Environment variables:
Not set
global.json file:
Not found
Learn more:
https://aka.ms/dotnet/info
Download .NET:
https://aka.ms/dotnet/download
Result after deleting:
Very strange case, I just "published" the project standalone on windows x64.
This is the page loading time.
@Alerinos Does that mean that slow behavior wouldn't happen on the published application? Yeah, that is strange. I have some questions.
@jsakamoto
How did you run the app when that slow behavior occurred? Which did you start the app with debugging or without debugging on Visual Studio?
Debug Any CPU
If you run it by the "dotnet run" command in the app, how long will it take the first HTML document to load? Will the speed be different from the execution of the published app?
The first page loading takes a very long time, then it is faster but nevertheless it is long.
This is the first time I have seen such an example. Usually, the debug mode lowers the speed of the website by 20-30%, unfortunately in this case it is several times more
@Alerinos Thank you for answering. First, I had guessed the reason for this issue might be involved with something in the Visual Studio's debugger. However, your last report said you could reproduce this issue without running it on Visual Studio (just run it with a simple "dotnet run" .NET CLI command). That fact makes me has been confusing.
There should be something reason for this issue, but I have no idea how to investigate this problem at this time. I'll try to search for something information to resolve this problem on the internet.
@Alerinos Could you try the investigation steps below to capture the performance information and store it in a file on which part of the program was spending a lot of CPU time?
Install the "dotnet trace" command as the following.
> dotnet tool install --global dotnet-trace
Run the target program. For example, if the target program is the "PerformanceCheck" I attached before, execute the following command.
> dotnet run PerformanceCheck
Get the process id of the target program by executing the following command In another terminal console. The command below will show you the list of dotnet processes with their process id, process name, etc.
> dotnet trace ps
Execute the following command to get started capturing the performance information of the target program.
> dotnet trace collect -p {Process Id}
Access the target program. For example, to use the "curl" command to the "PerformancheCheck" Blazor Server program, please enter the following command in the other terminal console.
> curl https://localhost:7162/
After accessing the target program is finished, return to the terminal console, which is executing the "dotnet trace collect" command, and press Ctrl + C to abort the capturing process. (The target program can also be terminated.)
You will see a .nettrace file in the current folder where the "dotnet trace collect" command was executed. This file includes the CPU usage information. Please attach that .nettrace file to this issue thread. You can also open that .nettrace file on your Visual Studio to investigate it by yourself.
@jsakamoto Please take a look if I did right. Also forgive my absence, I had a lot of projects to close. PerformanceCheck.exe_20221024_170550.zip
PerformanceCheck.exe_20221024_171146.zip This is from the debug mode by visual studio.
@Alerinos Thank you for capturing the performance data. I spent a few hours investigating the performance data but could not figure out the reason for this performance issue so far. I'll continue to try to resolve this issue.
Hi @Alerinos , I published the new version of the Blazor Head Element Helper today, as a preview version, ver.7.3.0-preview.1.
I don't have any confidence at all that the latest version can resolve your performance issue or not, but could you try the latest version on your project? I hope the commit 891c8118 will resolve this performance issue.
with:
without:
@jsakamoto Looks like it helped, there is less time.
@Alerinos I'm happy to hear that! At first, the "PerformaceCheck" project on your PC took greater than 970 msec, as you told me. But after updating the package to the latest preview release, it took only 116 msec. It is greater than 8 times faster.
But I'm still wondering why there is such a speed difference between calling the Head element service (116 msec) and without it (43 msec). I've no idea at all, but I'm guessing that something like logging exceptions might be the root reason.
Anyway, I'll republish this library as an official version later.
By the way, did you already try that on your original project mentioned in your first post on this issue? It took over one second, as you said, but just my curiosity, I have interesting in how much faster after using the latest preview version of this library.
Hi, I noticed that with more meta tags it creates a performance issue and high latency.
I use C# Core 7 rc1 Blazor server side
I created my own provider:
Then I unleashed it:
Unfortunately, with such a large number of tags, the page loading time jumped from 0.3 seconds to 1.6 seconds. After turning off the library, the page loads in 0.3 seconds.
I count my time in generating HTML dom.
Now it runs tests on the network. Without HeadElement![image](https://user-images.githubusercontent.com/42449535/193075643-43c02619-f4e2-4fc8-83eb-58724db63d95.png)
from HeadElement![image](https://user-images.githubusercontent.com/42449535/193075827-09003147-7c04-4a4d-ab85-9f369920259d.png)
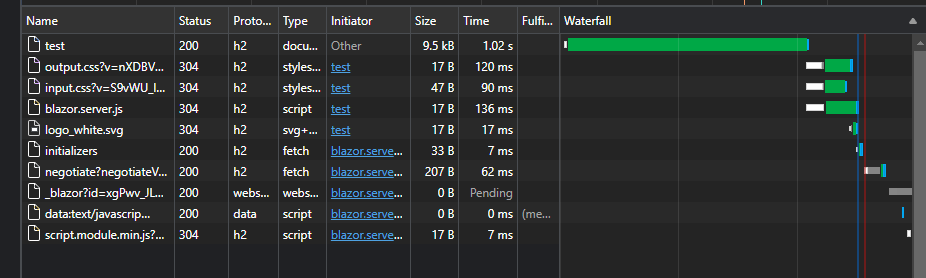
There is a problem somewhere, we need to create a benchmark.
The problem also occurs in the clean version of the project.