 RubaXa
commented
8 years ago
RubaXa
commented
8 years ago Yes, of course (+ option for switching to detailed view).
Closed paulirish closed 8 years ago
RubaXa
commented
8 years ago Yes, of course (+ option for switching to detailed view).
RubaXa
commented
8 years ago  paulirish
commented
8 years ago
paulirish
commented
8 years ago Excellent. thank you! @caseq
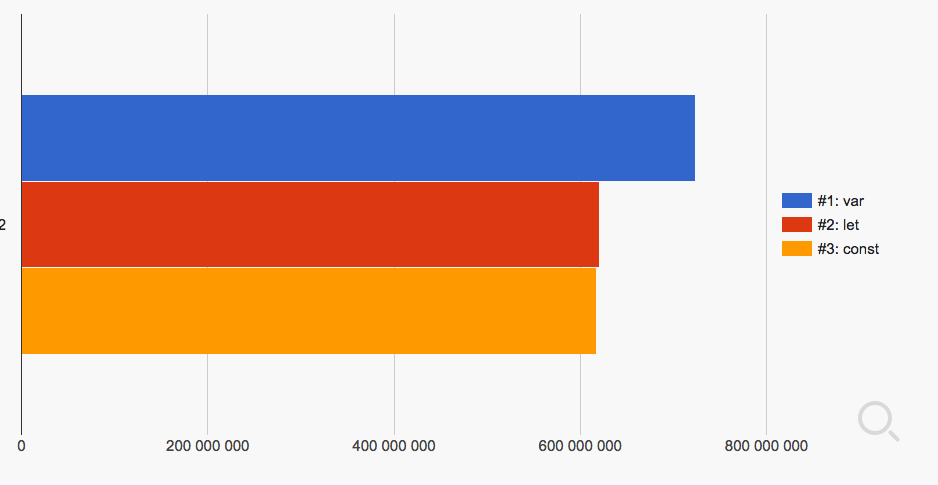
We just ran a test evaluating var vs const, and the difference was 4300 ops/sec to 4320 ops/sec.
However the chart made it feel like there was a massive difference in the two.
Can the x axis start at 0 for better comparison of the results?