 jthomasmock
commented
3 years ago
jthomasmock
commented
3 years ago Hi @arjunmenon10
I believe this resolved with the addition of:
gt_double_table() and gt_two_column_layout().
https://jthomasmock.github.io/gtExtras/reference/gt_double_table.html https://jthomasmock.github.io/gtExtras/reference/gt_two_column_layout.html
Can you check out those functions, and let me know if they solve the problems you have?
Thanks!
library(gt)
library(dplyr)

# add row numbers and drop some columns
my_cars <- mtcars %>%
  dplyr::mutate(row_n = dplyr::row_number(), .before = mpg) %>%
  dplyr::select(row_n, mpg:drat)

# create a one-argument function, passing data to `gt::gt()`
my_gt_fn <- function(x){
  gt(x) %>%
    gtExtras::gt_color_rows(columns = row_n, domain = 1:32)
}

# pass data, your function and the nrows
my_tables <- gt_double_table(my_cars, my_gt_fn, nrows = nrow(my_cars)/2)

# boom, this will return it to the viewer
my_output <- gt_two_column_layout(my_tables)
my_output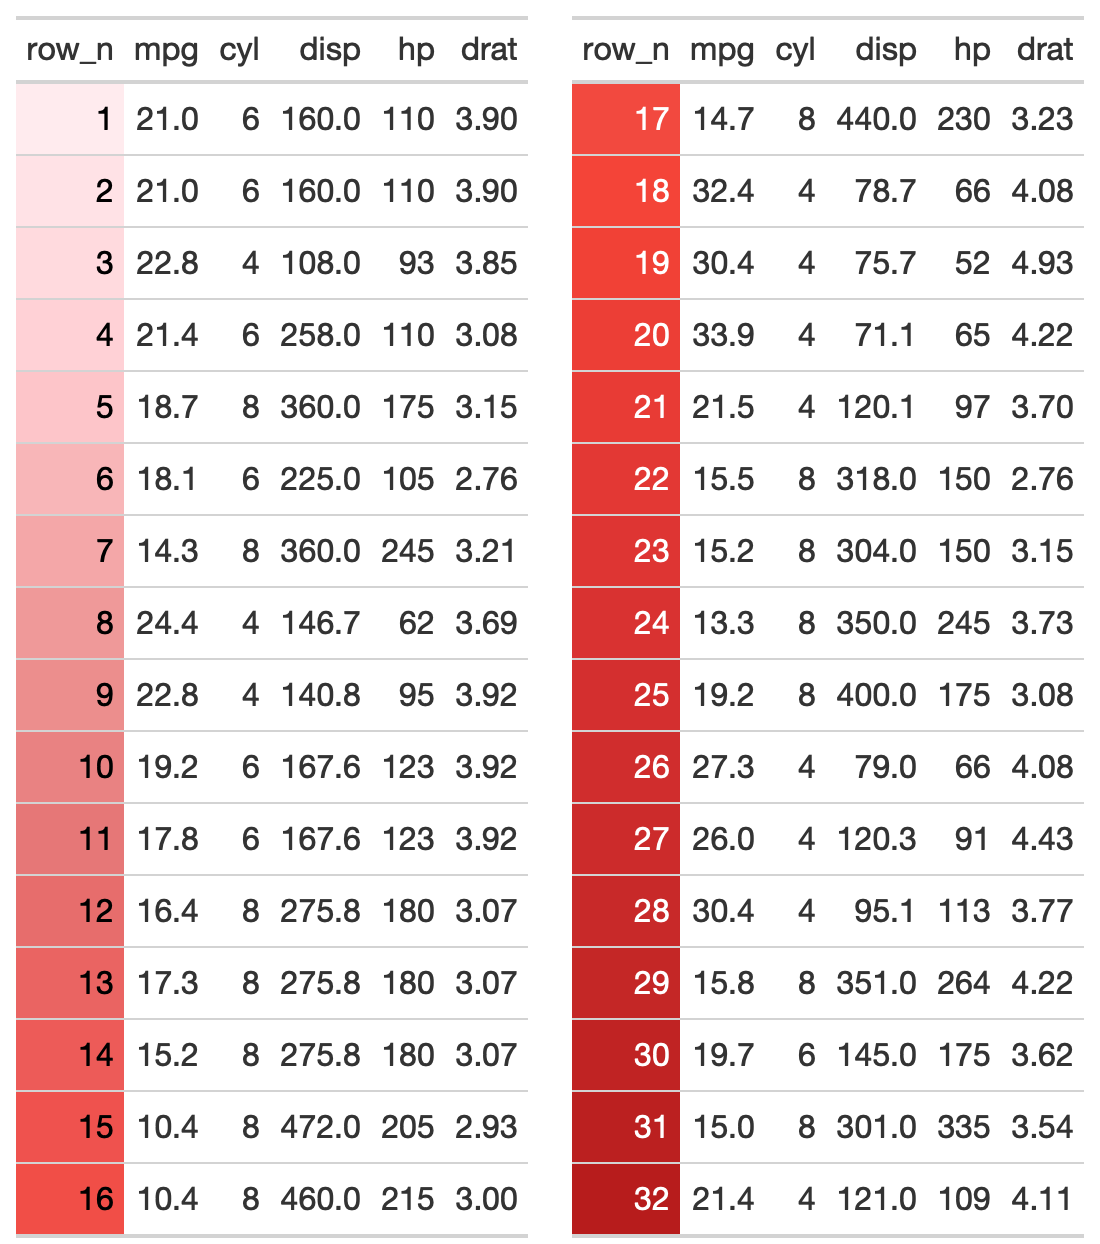
Trying to figure out ways to split up tables (16 teams in each column) to make tables more readable without using magick function