 welcome[bot]
commented
2 weeks ago
welcome[bot]
commented
2 weeks ago Thank you for opening your first issue in this project! Engagement like this is essential for open source projects! :hugs:
If you haven't done so already, check out Jupyter's Code of Conduct. Also, please try to follow the issue template as it helps other other community members to contribute more effectively.
 You can meet the other Jovyans by joining our Discourse forum. There is also an intro thread there where you can stop by and say Hi! :wave:
Welcome to the Jupyter community! :tada:
 JasonWeill
Hello!
A mistake occured when extracting NDVI and plotting trendlines with Sentinel 2, running S2_chart = ui.Chart.image.series() gives an error saying ui. is not defined. I'm using Windows, Python 3.12.3, ipygee-Version: 0.0.18, geetools-Version: 1.3.0, jupyeter lab extension manager is also active, lab-version3.0 and note book-version6.5.4. version6.5.4
Here is the mistake report: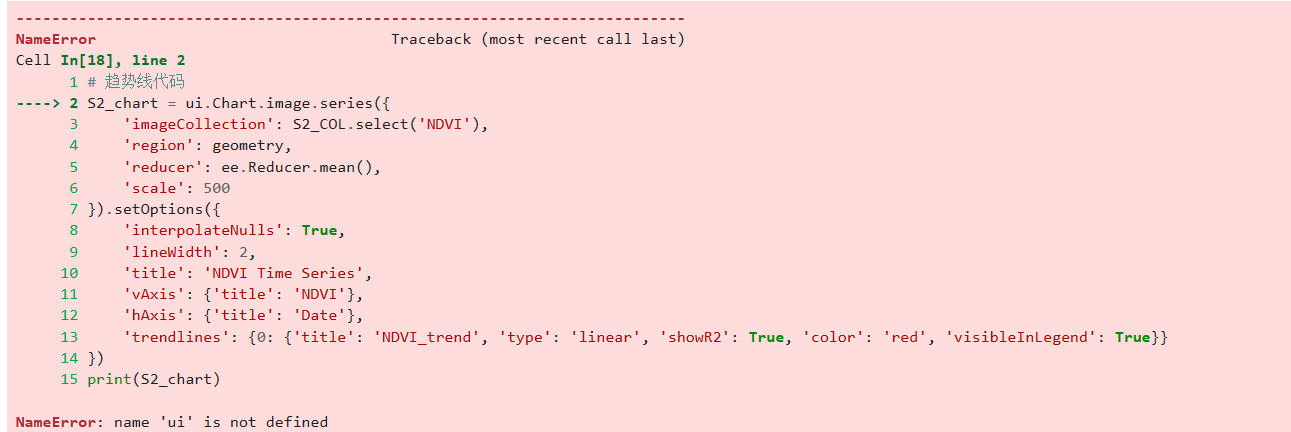
Here is the entire codes:
import ee import geemap geemap.set_proxy(port='my port') Map = geemap.Map(basemap = 'Esri.WorldImagery') shp_path = r'E:\postgraduate study\GIS文件\祁阳市.shp' shp_fc = geemap.shp_to_ee(shp_path)
geometry = shp_fc Map.centerObject(geometry, 9)
colorizedVis = { 'min': -0.8, 'max': 0.8, 'palette': ['blue', 'white', 'green'] }
def maskS2clouds(image): qa = image.select('QA60')
Bits 10 and 11 are clouds and cirrus, respectively.
def createNDVI(image): ndvi = image.normalizedDifference(["B8", "B4"]).rename('NDVI') return image.addBands(ndvi)
S2_COL = ee.ImageCollection("COPERNICUS/S2") \ .filterDate("2021-01-01", "2021-12-31") \ .filter(ee.Filter.lt('CLOUDY_PIXEL_PERCENTAGE', 20)) \ .filterBounds(geometry) \ .map(maskS2clouds) \ .map(createNDVI) \ .select('NDVI')
The mistake occured here:
S2_chart = ui.Chart.image.series({ 'imageCollection': S2_COL.select('NDVI'), 'region': geometry, 'reducer': ee.Reducer.mean(), 'scale': 500 }).setOptions({ 'interpolateNulls': True, 'lineWidth': 2, 'title': 'NDVI Time Series', 'vAxis': {'title': 'NDVI'}, 'hAxis': {'title': 'Date'}, 'trendlines': {0: {'title': 'NDVI_trend', 'type': 'linear', 'showR2': True, 'color': 'red', 'visibleInLegend': True}} }) print(S2_chart)
Thanks for your attention very much!