 ellisonbg
commented
6 years ago
ellisonbg
commented
6 years ago Can you try the following
- Remove the call to
plt.show() - Before you try to plot, run
%matplotlib inline
On Fri, Feb 16, 2018 at 9:05 AM, neuron878 notifications@github.com wrote:
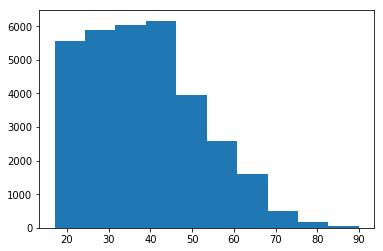
When creating a histogram, the axes do not display. I'm not sure if this is just limited to histograms.
Versions: JupyterLab 0.31.5 pandas 0.22.0 matplotlib 2.1.1 numpy 1.13.3 Firefox Quantum 58.0.2 (64-bit) Windows 7 Anaconda Navigator 1.7.0
Code:
import pandas as pd import numpy as np import matplotlib.pyplot as plt
df read in from excel file
plt.hist(df.age) plt.show()
The output looks like this: [image: image] https://user-images.githubusercontent.com/35700321/36319209-cf864312-1307-11e8-8d37-4461e8457d59.png
However, it should look like this: [image: image] https://user-images.githubusercontent.com/35700321/36319254-f84f1dc8-1307-11e8-9178-7e9fbc9c491e.png
— You are receiving this because you are subscribed to this thread. Reply to this email directly, view it on GitHub https://github.com/jupyterlab/jupyterlab/issues/3886, or mute the thread https://github.com/notifications/unsubscribe-auth/AABr0OHZevsd5qmucnDdnZAiwz0Fr4rsks5tVbVigaJpZM4SIo7W .
-- Brian E. Granger Associate Professor of Physics and Data Science Cal Poly State University, San Luis Obispo @ellisonbg on Twitter and GitHub bgranger@calpoly.edu and ellisonbg@gmail.com
 neuron878
 ian-r-rose
When creating a histogram, the axes do not display. I'm not sure if this is just limited to histograms.
Versions: JupyterLab 0.31.5 pandas 0.22.0 matplotlib 2.1.1 numpy 1.13.3 Firefox Quantum 58.0.2 (64-bit) Windows 7 Anaconda Navigator 1.7.0
Code:
The output looks like this:
However, it should look like this: