 kazuto1011
commented
11 months ago
kazuto1011
commented
11 months ago As I mentioned in #2, nuScenes was built w/ Velodyne HDL-32E (namely 32 beams).
import numba
import numpy as np

@numba.jit(nopython=True, parallel=False)
def scatter(array, index, value):
    for (h, w), v in zip(index, value):
        array[h, w] = v
    return array

def load_points_as_images(
    point_path: str,
    scan_unfolding: bool = True,
    H: int = 32,
    W: int = 1024,
    min_depth: float = 0.0,
    max_depth: float = 100.0,
):
    points = np.fromfile(point_path, dtype=np.float32).reshape((-1, 5))
    ring_id = points[:, [4]]
    xyz = points[:, :3]
    x = xyz[:, [0]]
    y = xyz[:, [1]]
    z = xyz[:, [2]]
    intensity = points[:, [3]]
    depth = np.linalg.norm(xyz, ord=2, axis=1, keepdims=True)
    mask = (depth >= min_depth) & (depth <= max_depth)
    points = np.concatenate([xyz, intensity, depth, mask], axis=1)

    if scan_unfolding:
        grid_h = 31 - ring_id.astype(np.int32)  # upside down
    else:
        fup, fdown = np.deg2rad(10.67), np.deg2rad(-30.67)
        elevation = np.arcsin(z / depth) + abs(fdown)
        grid_h = 1 - elevation / (fup - fdown)
        grid_h = np.floor(grid_h * H).clip(0, H - 1).astype(np.int32)

    azimuth = -np.arctan2(y, x)  # [-pi,pi]
    grid_w = (azimuth / np.pi + 1) / 2 % 1  # [0,1]
    grid_w = np.floor(grid_w * W).clip(0, W - 1).astype(np.int32)

    order = np.argsort(-depth.squeeze(1))
    grid = np.concatenate((grid_h, grid_w), axis=1)
    proj_points = np.zeros((H, W, 4 + 2), dtype=points.dtype)
    proj_points = scatter(proj_points, grid[order], points[order])

    return proj_points.astype(np.float32)
import matplotlib.pyplot as plt
point_path = "v1.0-mini/samples/LIDAR_TOP/n008-2018-08-01-15-16-36-0400__LIDAR_TOP__1533151603547590.pcd.bin"
kwargs = dict(scan_unfolding=True, W=512)
image = load_points_as_images(point_path, **kwargs)
fig, ax = plt.subplots(image.shape[-1], 1, figsize=(10, 5), constrained_layout=True)
fig.suptitle(kwargs)
for i in range(image.shape[-1]):
ax[i].imshow(image[..., i], cmap="turbo", interpolation="none")
ax[i].axis("off")
ax[i].set_title("XYZIDM"[i])
plt.axis("off")
plt.show() Huang-yihao
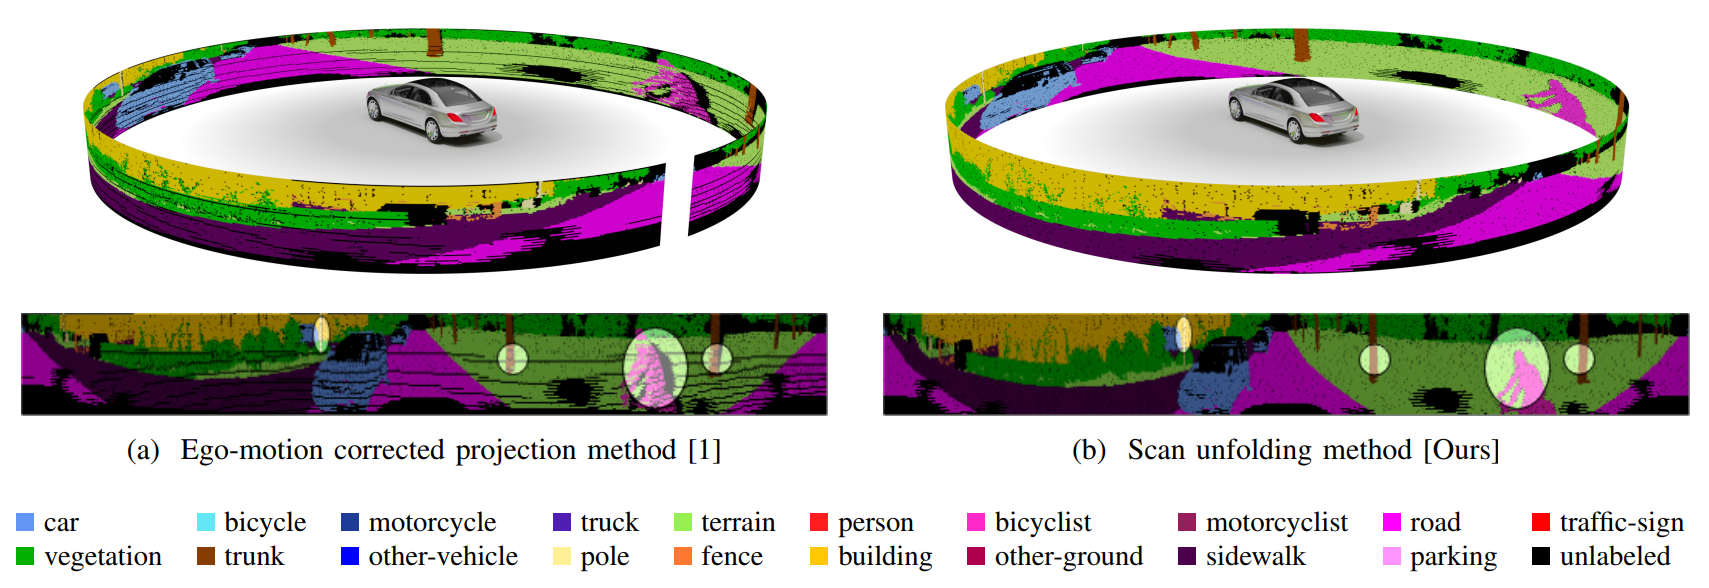 [The image is from
Hello, I revised the function with your suggestion and generated some range view maps. But I do not know whether they are correct or not. The load_pts_as_img is
And the main code is
The generated grid map is as follows.
The xyz is as follows.
The reflectance map is as follows.
I think the maps seem somewhat correct. But there are two questions (1) Is the height and width correct? The range map seems exist some region without information. (2) Do I need to normalize the XYZ, depth and reflectance?
Thank you very much for the help!