kellpossible / avalanche-report

A simple self-hosted web server for creating and managing an avalanche forecast for a region, along with accepting public observations.
GNU Affero General Public License v3.0
21 stars 2 forks source link

Render our own hazard map #39

Open kellpossible opened 1 year ago

kellpossible commented 1 year ago

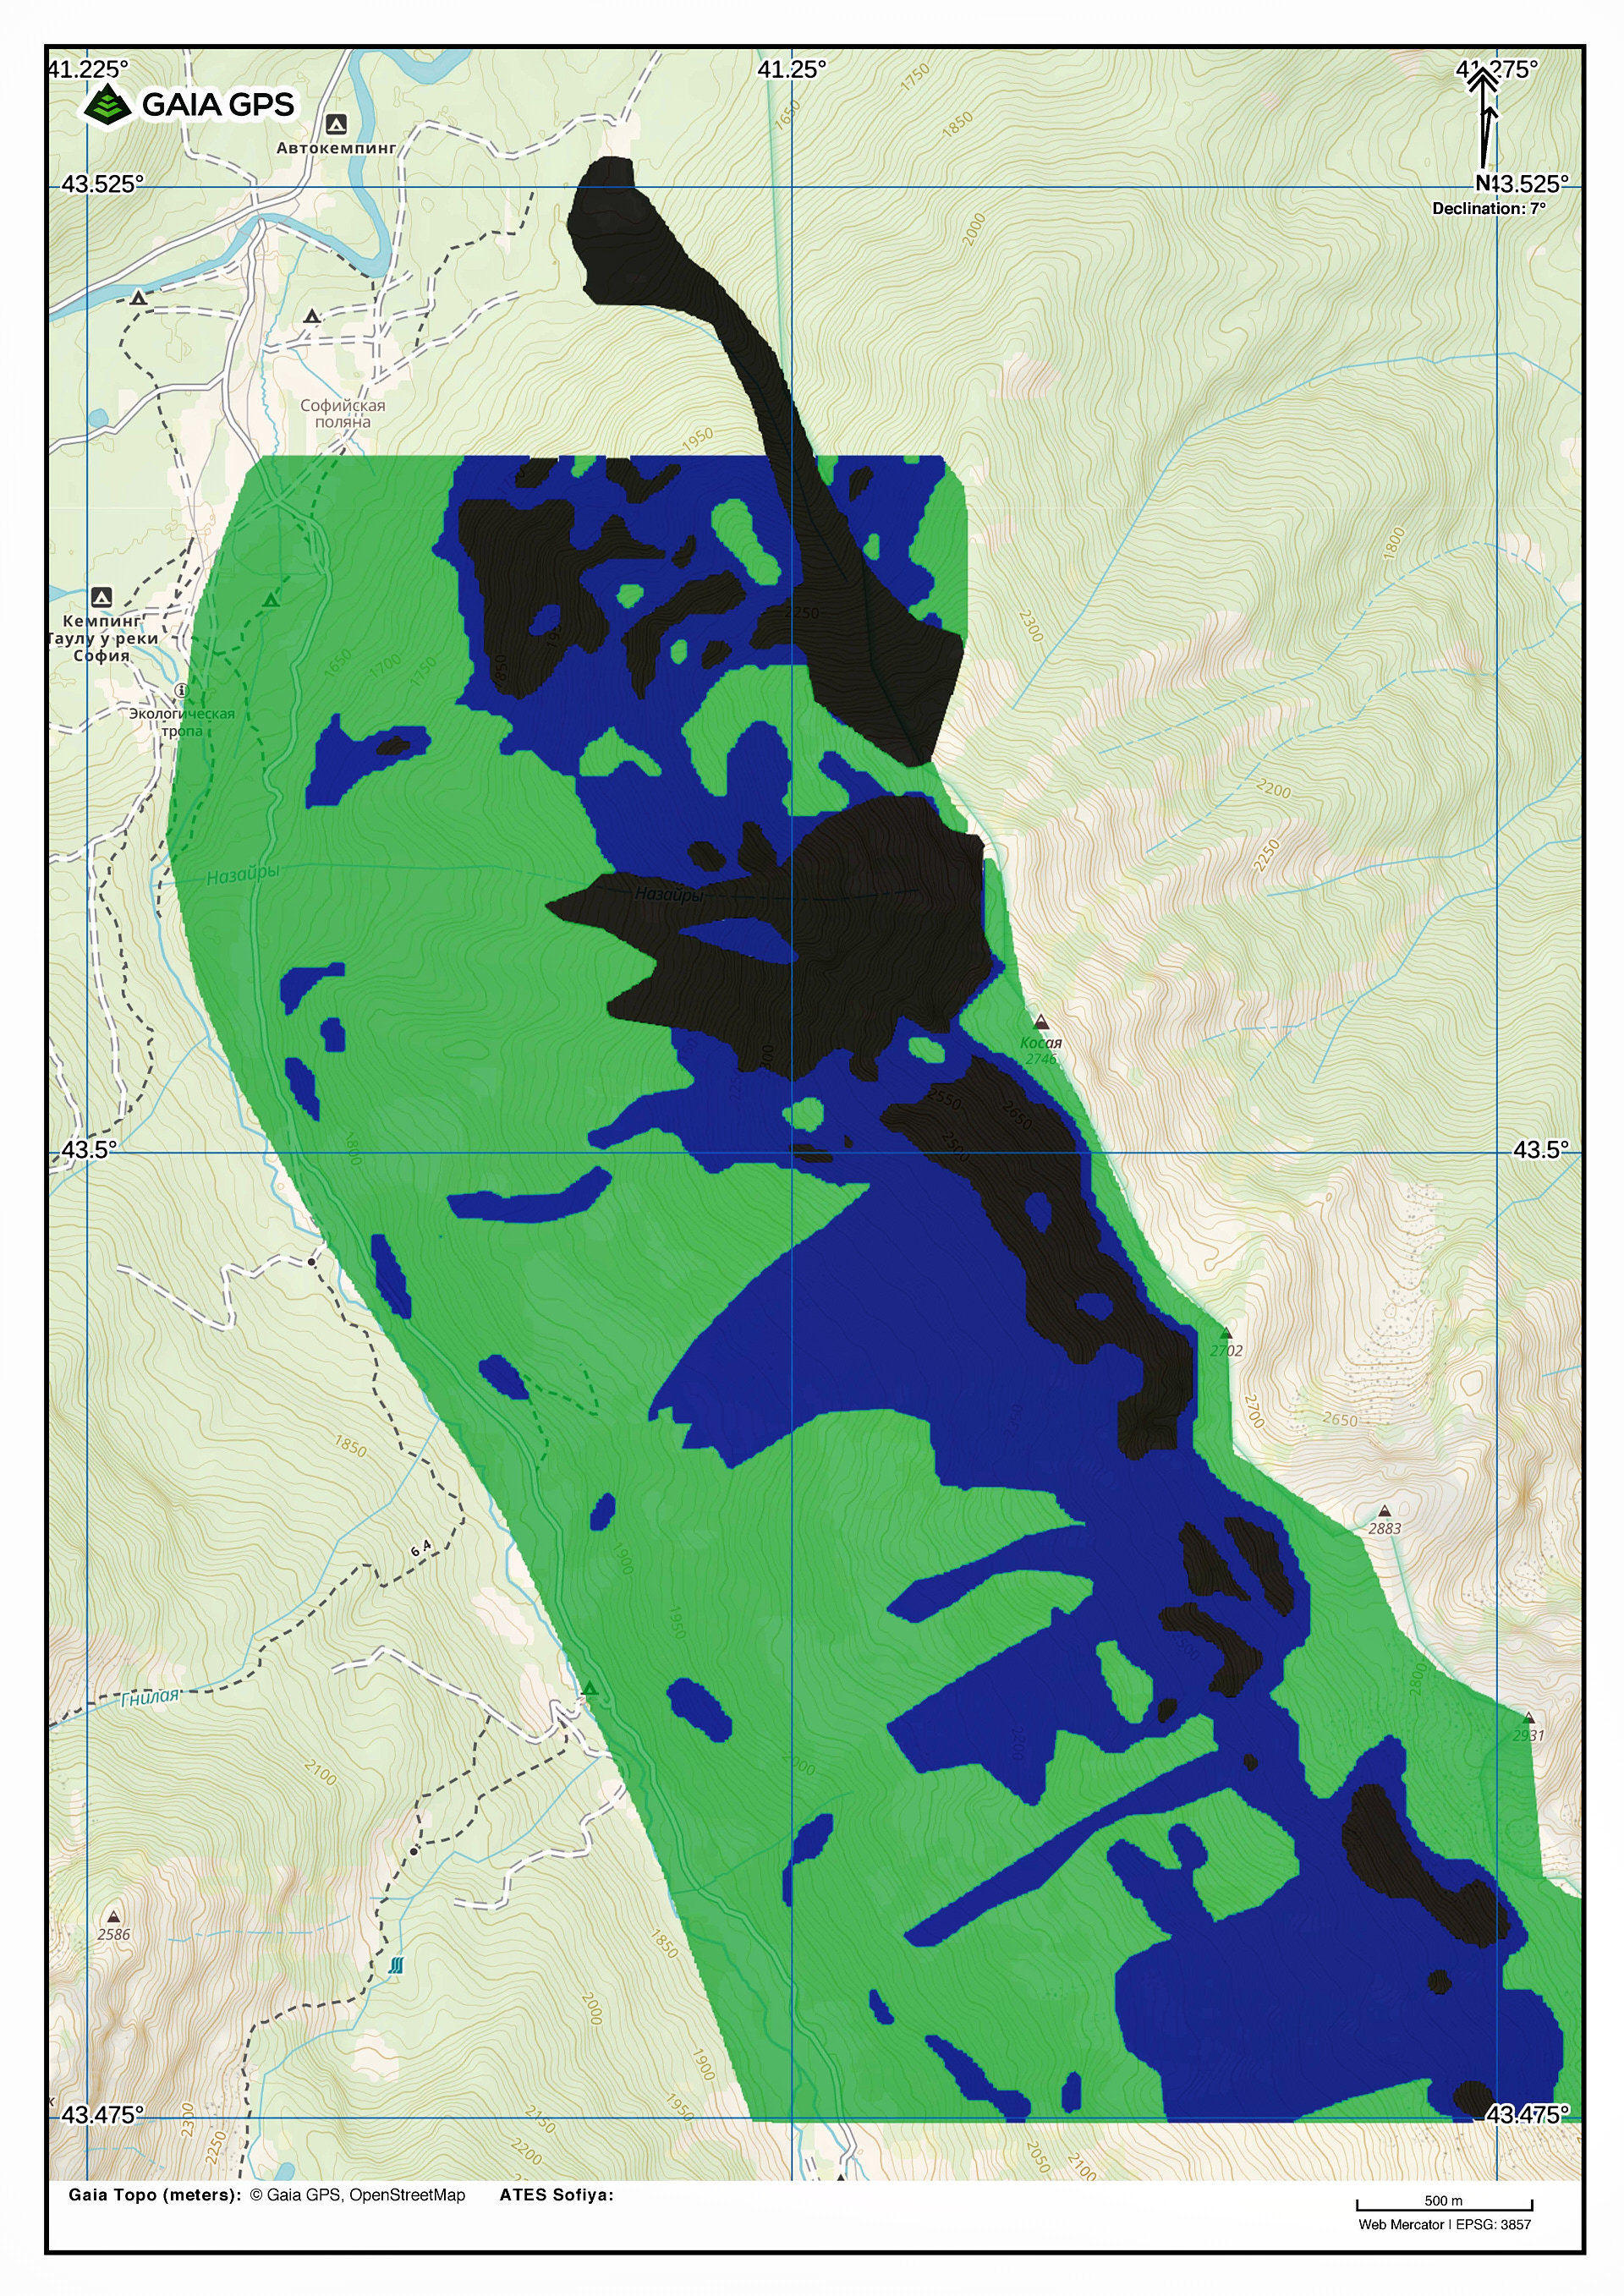
Currently the hazard maps are generated by @PSAvalancheConsulting in a semi-manual step involving R. Ideally we could generate these automatically from the forecast in question. This would also allow us to retain hazard maps per forecast as an alternative to #19 We can also include this in the #11 html forecast.

We would need the shape files, and can use the same/similar leaflet setup to what the current map uses. We may also be able to scrape the shape files from there ourselves, although it's pretty obfuscated, might be easier to get these directly from @PSAvalancheConsulting

kellpossible commented 11 months ago

I've had some more thoughts about this, and made a bit more of a start on it a few days ago. I got https://docs.rs/gdal/latest/gdal/ installed and working, and started on a geo crate to implement the data processing functionality we need.

Here is the user workflow I foresee for creating forecast maps:

  1. In the admin directory there is a "forecast area" app.
  2. User draws the forecast area on a map
  3. User uploads GeoTiffs which cover the forecast area they are interested in. Some warning will be displayed if it is not completely covered. The outline will be displayed on the same map
  4. User clicks the render button to render the web mercator version of the heightmap and display it on the same map, with options to preview a hazard and elevation band version.

Under the hood, the heightmap is stored as something like PNG as web mercator tiles in the database. Inspiration can be taken from other sqlite based formats for storing these tile maps. When the tiles are served, they are modified on the fly by the server in a separate thread pool to colorize them according to the situation.

kellpossible commented 11 months ago

We want to pre-render the map to tiles as the coordinate transformation and resampling will be compute and memory intensive.

Obvious candidates for tile formats are:

I realised that if we are going to render to tiles, we should not first render to grayscale 8 bit png because we will lose significant vertical resolution needed for calculations. This probably rules out using any pre-existing tools like https://gdal.org/programs/gdal2tiles.html to perform the job. We should first pre-render to GeoTiff (or similar) tiles in the same format, and then use these as the basis for rendering the final png files on the fly. Probably we could maintain a tile cache to improve performance greatly, as most people are just going to see the map with the exact same top level tiles.

For the Gudauri area minimum viable product, I could probably perform this initial render task offline using some gdal based python scripts.

kellpossible commented 11 months ago

Last night I started work playing around with gdal2tiles.py to see if I could modify it to produce geotif. I was able to get the base tiles (highest detail) working, but not the overview tiles (merging of multiple base tiles). The biggest issue was having data overflow with Gdal buffers having the wrong data type specified. Overall the task is not huge.

Just out of interest to learn more, and to see how much work it would be to eventually replace GDAL with pure rust code to significantly reduce the dependency graph and security risk, as it's a huge lump of amazing, yet poorly documented C/C++ code, I started work on a Geotiff parser based on https://github.com/image-rs/image-tiff which appears to already be working fairly well. It turns out Geotiff is just a bunch of standard Tiff tags that need to be parsed and combined to form the data set.

I also had a play with https://github.com/3liz/proj4rs/ . It turns out that one of the more challenging parts will be figuring out which projection parameters to use from the Geotiff metadata. The image in the fixture uses ESPG:4326 WGS84. We probably want to reproject this to ESPG:3857 Web Mercator, however I have also learned that the WTMS tile standard also supports tiles in CRS84, which is essentially ESPG:4326 with the lat and lon fields swapped, so it may be possible just to get the viewer to do the reprojection in that case. This may however limit the number of clients that can consume the tiles.

kellpossible commented 11 months ago

For the leaflet map we can use this https://stackoverflow.com/a/41631385 to disable pan on 1 finger input on mobile, which currently annoyingly prevents the user from scrolling the page unless they can somehow touch the edge. With this we should be able to make the map fill the full width of the screen too, as the edges are no longer required for scroll input.

kellpossible commented 6 months ago

We can use https://github.com/frewsxcv/crs-definitions which has proj4 definitions for ESPG codes

kellpossible commented 6 months ago

For the slope angle map, if the x/y unit is degrees, we should first reproject the provided DEM into a meters based coordinate system, like UTM (with an appropriate zone for the area), then perform the slope angle calculations in meters (much easier and more accurate!), and then reproject it to whatever our final consumption coordinate system is (web mercator I guess).

PSAvalancheConsulting commented 6 months ago

One issue I see is resolution. Available data is limited to 25 m to 30 m, no? From my previous PhD research, I would recommend 10 m, as this smoothens terrain featured covered by snow.

UTM is always better. Not sure why degree-based systems are still around

On 2024-02-05 08:33, Luke Frisken wrote:

For the slope angle map, we should first reproject the provided DEM into a meters based coordinate system, like UTM (with an appropriate zone for the area), then perform the slope angle calculations in meters (much easier and more accurate!), and then reproject it to whatever our final consumption coordinate system is (web mercator I guess).

-- Reply to this email directly, view it on GitHub [1], or unsubscribe [2]. You are receiving this because you were mentioned.Message ID: @.***>

Links:

[1] https://github.com/kellpossible/avalanche-report/issues/39#issuecomment-1926459006 [2] https://github.com/notifications/unsubscribe-auth/AH7NZQDGXXBTAYUVJ4GXVNDYSCKOTAVCNFSM6AAAAAAYB75S4CVHI2DSMVQWIX3LMV43OSLTON2WKQ3PNVWWK3TUHMYTSMRWGQ2TSMBQGY

kellpossible commented 6 months ago

I guess degree based systems are convenient with a single projection that covers the entire globe (although terribly useless at the poles!)?

In terms of resolution, we could start with what's publicly available perhaps ASTER GDEM 30m data or https://www.eorc.jaxa.jp/ALOS/en/dataset/aw3d30/aw3d30_e.htm AW3D30, and aim to purchase better quality data from one of the satellite providers in the future:

kellpossible commented 6 months ago

Hopefully the 30m data set is enough to do things like render elevation zones, and aspects, we could highlight areas where problem types are present, ignoring the slope angle, or perhaps with some low threshold like 20 degrees.

PSAvalancheConsulting commented 6 months ago

I found 30 m sufficent for ATES mapping https://freight.cargo.site/t/original/i/2ccf2c8291b954977857a81ce2b6366cbbce96d5093fd70be877d4ee717f36ac/Arkhyz_Cheget-Chat_GaiaGPS-2-1.jpg

Aspects and problem zones would be OK to do with 30 m. I found ASTER better in high latitudes and SRTM better in Caucasus

On 2024-02-06 08:28, Luke Frisken wrote:

Hopefully the 30m data set is enough to do things like render elevation zones, and aspects, we could highlight areas where problem types are present, ignoring the slope angle, or perhaps with some low threshold like 20 degrees.

-- Reply to this email directly, view it on GitHub [1], or unsubscribe [2]. You are receiving this because you were mentioned.Message ID: @.***>

Links:

[1] https://github.com/kellpossible/avalanche-report/issues/39#issuecomment-1929006760 [2] https://github.com/notifications/unsubscribe-auth/AH7NZQGVIU4RP6JDV6DHLFLYSHSTTAVCNFSM6AAAAAAYB75S4CVHI2DSMVQWIX3LMV43OSLTON2WKQ3PNVWWK3TUHMYTSMRZGAYDMNZWGA