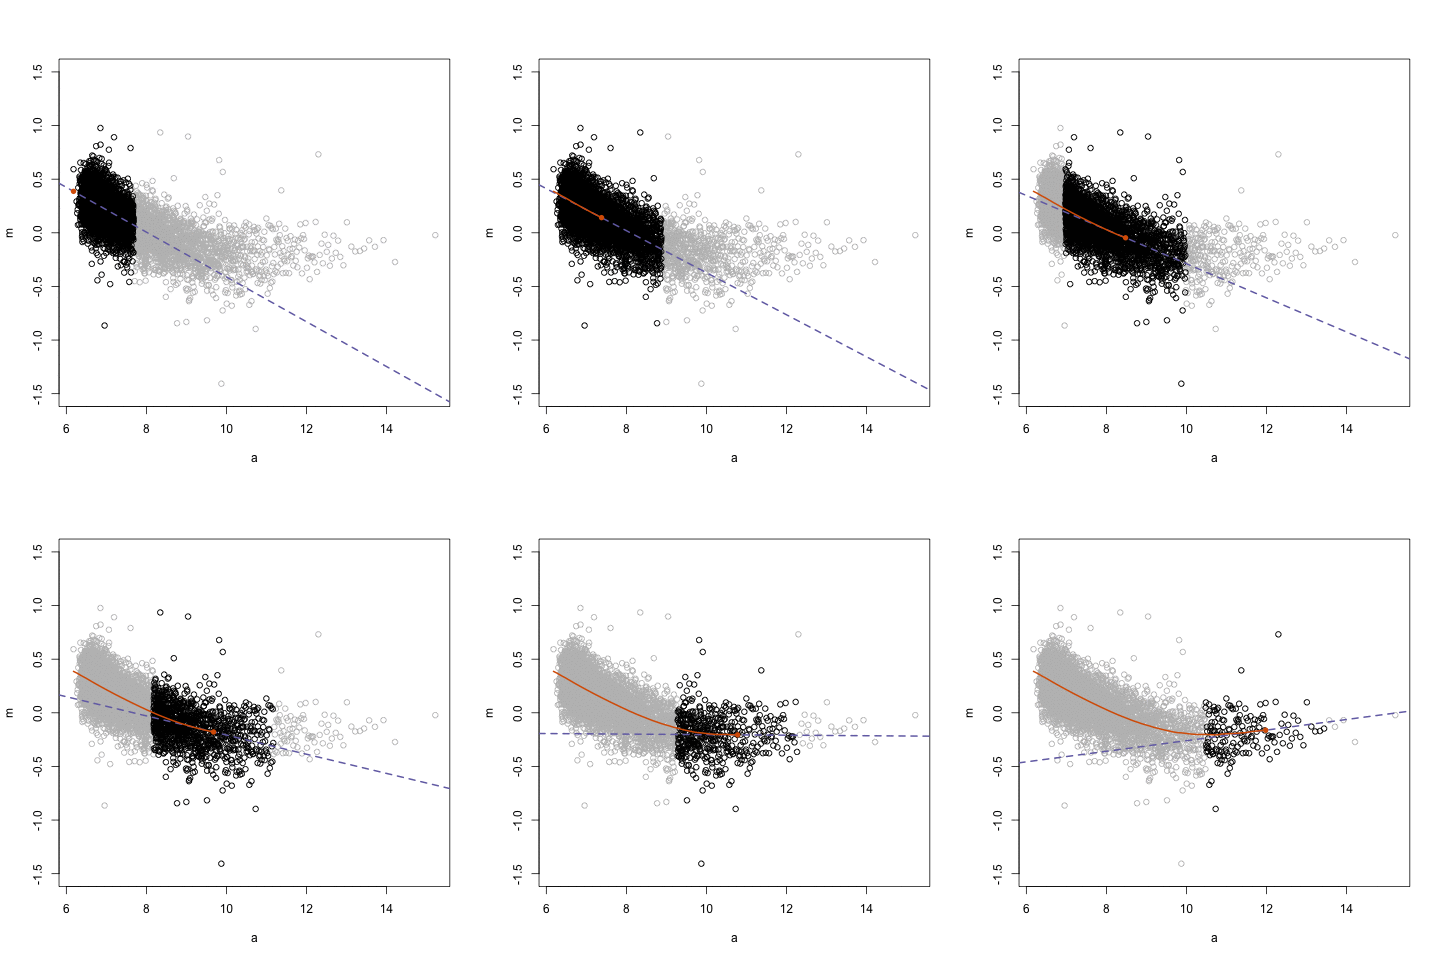
The easiest way to explain what it needs to do:

Closed koaning closed 5 years ago
The easiest way to explain what it needs to do:

DIBS
Second that
library(tidyverse)

df <- data_frame(xs=1:120, ys=10*sin(xs/10) + rnorm(120, 0, xs/10)) %>%
  filter(ifelse((xs < 100) & (xs > 75), FALSE, TRUE))

ggplot() +
  geom_point(data=df, aes(xs, ys)) +
  geom_smooth(data=df, aes(xs, ys), span=0.5)
ggplot() +
  geom_point(data=df, aes(xs, ys)) +
  geom_smooth(data=df, aes(xs, ys), span=0.1)
ggplot() +
  geom_point(data=df, aes(xs, ys)) +
  geom_smooth(data=df, aes(xs, ys), span=1)
Nice book, thanks!
I expect to have a few hours next week to finish up what we started.
It seems to be in statsmodels. Maybe it is not a right fit.
I've always wanted to have loess regression in python. R has a cool version of it but it has always been missing. This would be a great model to host here.