konstantint / matplotlib-venn

Area-weighted venn-diagrams for Python/matplotlib
MIT License
495 stars 67 forks source link

VennRegionException #30

Closed nesilin closed 6 years ago

nesilin commented 7 years ago

Hi!

I'm using venn3 to plot 3 sets of names and the following exception appeared:

/home/isentis/anaconda3/lib/python3.5/site-packages/matplotlib_venn/_venn3.py in venn3(subsets, set_labels, set_colors, alpha, normalize_to, ax)
    344     areas = compute_venn3_areas(subsets, normalize_to)
    345     centers, radii = solve_venn3_circles(areas)
--> 346     regions = compute_venn3_regions(centers, radii)
    347     colors = compute_venn3_colors(set_colors)
    348 

/home/isentis/anaconda3/lib/python3.5/site-packages/matplotlib_venn/_venn3.py in compute_venn3_regions(centers, radii)
    198     aB, _ = B.subtract_and_intersect_circle(A.center, A.radius)
    199     aBc, aBC = aB.subtract_and_intersect_circle(C.center, C.radius)
--> 200     aC, _ = C.subtract_and_intersect_circle(A.center, A.radius)
    201     abC, _ = aC.subtract_and_intersect_circle(B.center, B.radius)
    202     return [Abc, aBc, ABc, abC, AbC, aBC, ABC]

/home/isentis/anaconda3/lib/python3.5/site-packages/matplotlib_venn/_region.py in subtract_and_intersect_circle(self, center, radius)
    151 
    152             if intersections is None:
--> 153                 raise VennRegionException("Invalid configuration of circular regions (holes are not supported).")
    154             elif np.all(abs(intersections[0] - intersections[1]) < tol) and self.radius < radius:
    155                 # There is a single intersection point (i.e. we are touching the circle),

VennRegionException: Invalid configuration of circular regions (holes are not supported).

I can't figure out what is exactly going on and whether there is something I can do to solve it. I bit of help would be appreciated. Thanks!

konstantint commented 7 years ago

The layout algorithm is not perfect and there may be rare corner cases where it fails to layout the regions. You should be able to see how the circles should look like using the venn3_circles method (which only plots the circles, without going through the steps of splitting them into regions).

It would be nice if you could provide the actual subset sizes which lead to this error. Try calling

  matplotlib_venn._venn3.compute_venn3_subsets(a,b,c)

(where a,b,c are your three sets) and posting the resulting 7-number tuple here.

nesilin commented 7 years ago

Hi!

I 'm generating different venn3 plots. For the cases where the 7 numbers ([Abc, aBc, ABc, abC, AbC, aBC, ABC]) looks like that:

CASE A: (1, 0, 0, 32, 0, 76, 13) It gives the attached plot but python warns about a BadCirclePositioning: warning:

/home/isentis/anaconda3/lib/python3.5/site-packages/matplotlib_venn/_venn3.py:117: UserWarning: Bad circle positioning
  warnings.warn("Bad circle positioning")

case_a

CASE B However, when now C is bigger and contains all A and B it gives the error

VennRegionException: Invalid configuration of circular regions (holes are not supported).

and its 7 position-numbers and venn3_circles plot look like that: (1, 0, 0, 650, 0, 76, 13) case_b

konstantint commented 7 years ago

Ugh. As I said these are the ugly corner cases which the current layout algorithm does not handle well, and I do not know a simple solution which would not involve complicated geometry, hacks or optimization solving.

As a hack in your particular case you could simply tune some of the zero regions slightly - this usually fixes such problems. I understand this is ugly if you need to generate many diagrams programmatically, but I don't know any other immediate fixes at the moment. E.g.

v = venn3((1, 0.1, 0, 650, 0, 76, 13))
v.get_label_by_id('010').set_text('')

Thanks for finding this example.

nesilin commented 7 years ago

Thanks for the reply!

konstantint commented 7 years ago

I'll keep the issue open. The problem is still a bug and deserves fixing one day.

foriin commented 6 years ago

Hi, Konstantin! I guess I have somewhat similar issue. I am plotting using genomic data and sometimes getting output like this: bad diagram 
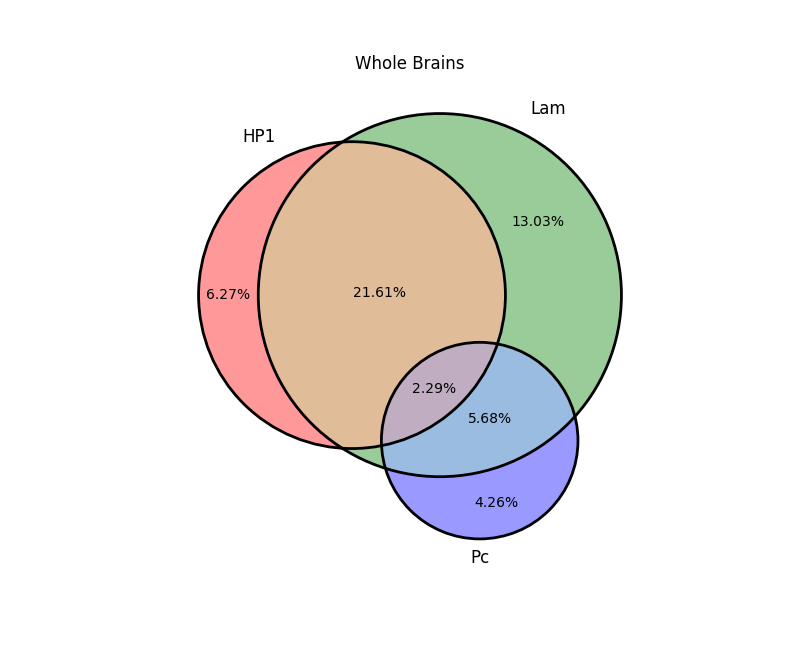
What 'hack' can I use to get rid of little green triangle in the bottom? The numbers were: 7549417, 15685620, 26018311, 5128906, 301048, 6841264, 2762301

konstantint commented 6 years ago

What you want to do is to "pull" the size of the set A&B&~C larger - this will force the diagram to have enough weight there to not be lost in the scaling. There is a special method venn3_unweighted which lets you specify set weights used to position the circles separately from the numbers displayed on them. Namely, try this:

sets = (7549417, 15685620, 26018311, 5128906, 301048, 6841264, 2762301)
venn3_unweighted(sets, 
                 subset_areas=(7549417, 15685620, 26018311, 5128906, 10*301048, 6841264, 2762301),
                 subset_label_formatter=lambda x: '%0.2f%%' % (100*x/sum(sets)))

(Note that I'm getting different percentages from your picture)

foriin commented 6 years ago

Thank you very much! You shouldn't worry about the percentages because they represent something different, each of the circles represent length of protein-dna interaction domains, and intersections show domains which are common for given 2 or 3 proteins.

konstantint commented 6 years ago

I reformulated the issue into a proper task, addressing it (#35). Let's call it "progress" :)