 k8s-ci-robot
commented
8 months ago
k8s-ci-robot
commented
8 months ago This issue is currently awaiting triage.
If Ingress contributors determines this is a relevant issue, they will accept it by applying the triage/accepted label and provide further guidance.
The triage/accepted label can be added by org members by writing /triage accepted in a comment.
Instructions for interacting with me using PR comments are available [here](https://git.k8s.io/community/contributors/guide/pull-requests.md). If you have questions or suggestions related to my behavior, please file an issue against the [kubernetes/test-infra](https://github.com/kubernetes/test-infra/issues/new?title=Prow%20issue:) repository.
 longwuyuan
 esigo
esigo dkrizic
 github-actions[bot]
 c0deaddict
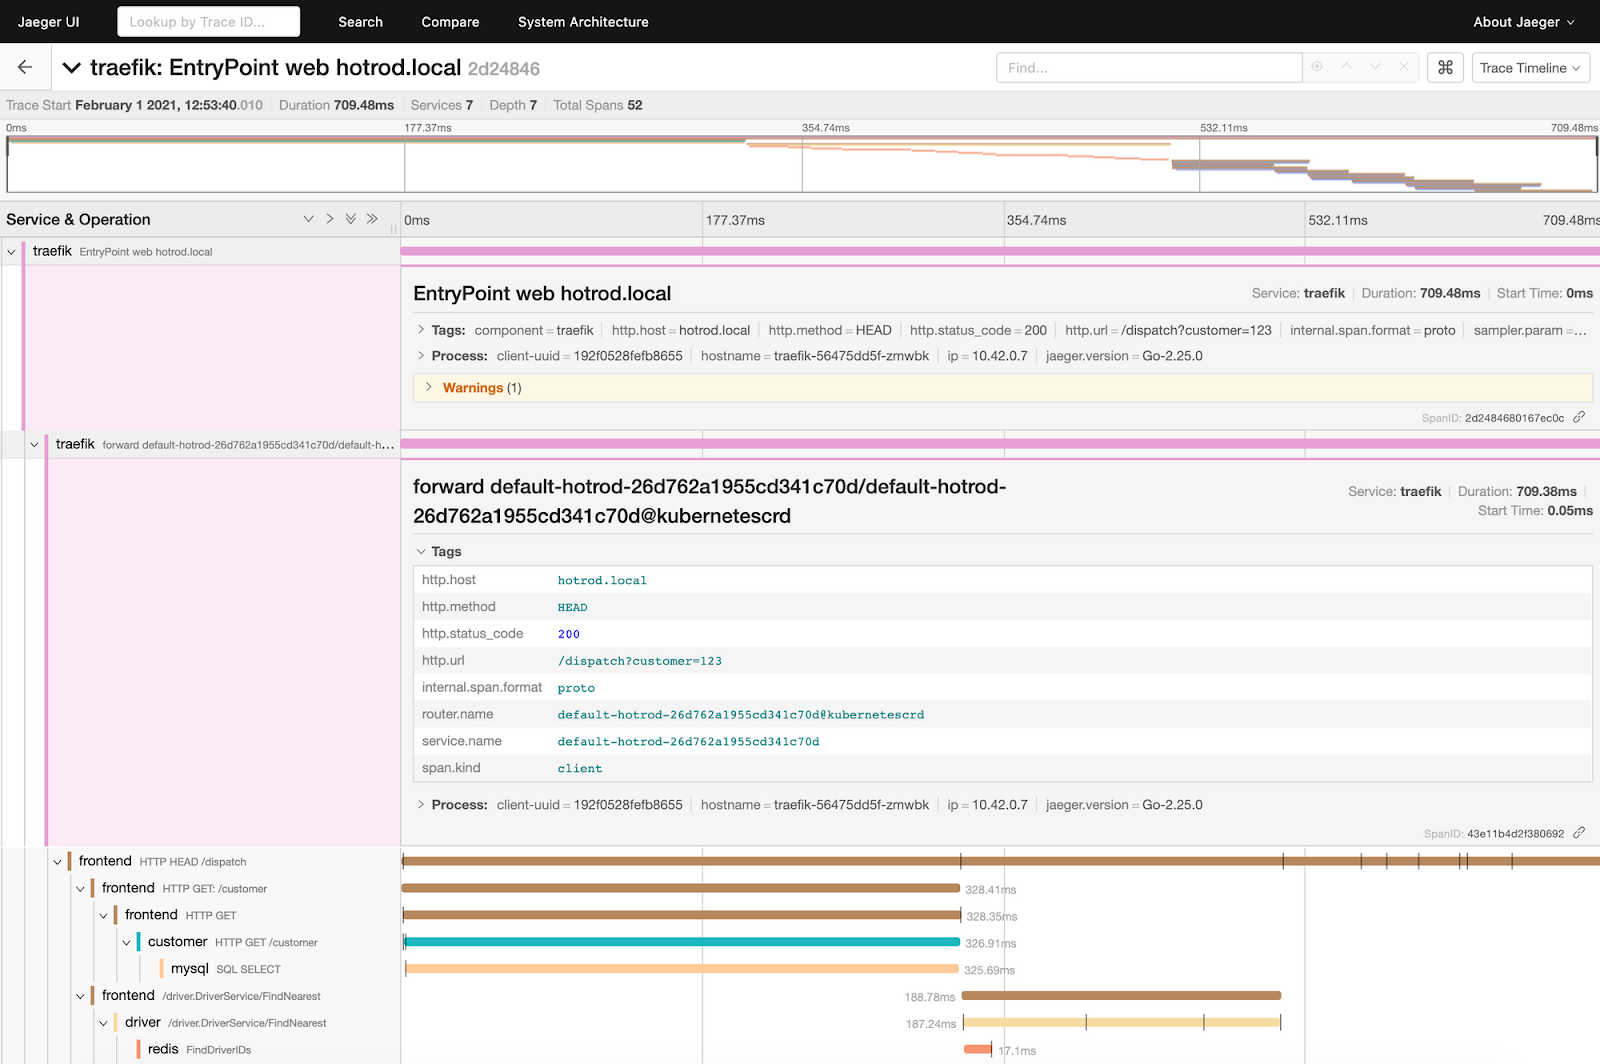
What happened:
I am using OpenTelemetry with Ingress-Nginx. This works so far and looks like this in Grafana/Tempo:
The problem is that the Metrics-Generator of Grafana does not work correctly. The Service Graph looks like this:
(ignore the component yasm-proxy-odbc). The Problem is, that there is no direct connection from ingress-nginx to my backend yasm-backend.
What you expected to happen:
According to the Otel Spec the Ingress-Nginx is both a SERVER and a CLIENT to the backend. Therefore it should emit two spans:
Environment:
Azure Kubernetes Service
How was the ingress-nginx-controller installed:
How to reproduce this issue:
Access the Ingress from outside and observe the traces. You will see one span coming from the ingress-controller. It is of type server:
It is of type server. The next trace is of type server as well and this leads to the problem that tracing backends don't handle that correctly. There should be a second span of type client.