Linvill
commented
4 years ago
Linvill
commented
4 years ago First of all, also from my side, thank you very much for putting this package together! I am intending to use the package for the clustering of pico-earthquakes based on waveform similarity.
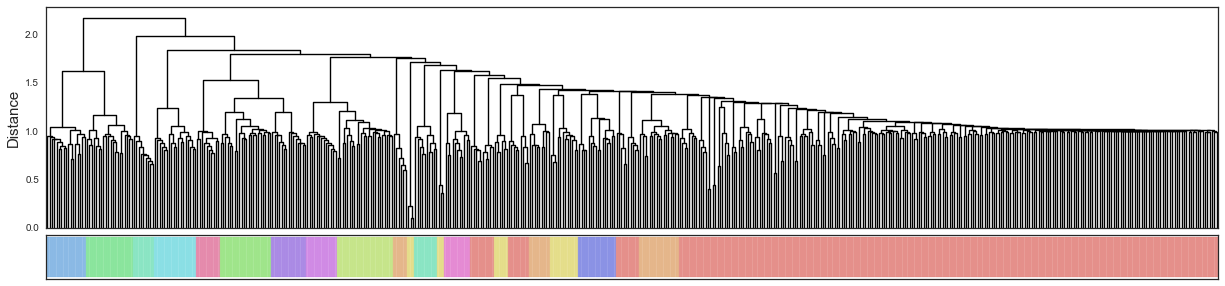
To get to know the package, I am currently trying to replicate your example here @jolespin. Assuming that your "R-generated solution" above is correct, I am a little confused, because it seems that your first (black) cluster seems to be different, than the one in the "Python-generated solution". Also in my replicated representation using this package, the black cluster does not appear as you have it in your "R-generated solution" (see below).
Trying to figure out what the cause for that could be, I may just think of the linkage method used in R ("ward.D2") compared to scipy ("ward"). Ultimately, I belief its not the cause because absolute linkage values (y-axis in the above plots) do match. Would anybody have an idea on the cause for this mismatch?
On further, more general question: Where are the leafs, which are not assigned to clusters because "minClusterSize = 10" is too large? Are these the black (R-generated solution) or red (Python-generated solution) leafs?

Thanks!
First off, thank you so much for creating this package. I've been needing something like this and wrote a wrapper with rpy2 but will use this instead from now on.
I am noticing some inconsistencies: (1) The clustering looks the same but the colors from
WGCNAseem to repeat themselves. Is this a WGCNA issue or an artifact of your note:(2) Can you elaborate on what you mean by the quote above? I keep getting clusters that overlap when I plot them ...
Here is the link to the dataframe: https://drive.google.com/file/d/1vp_jx8CfD90bvFcS6sbWN59U-_DQa48L/view?usp=sharing
Here's my Rcode:
Here is my python representation using the same parameters: