 tengfei
commented
12 years ago
tengfei
commented
12 years ago Hi
It's a bug for autoplot,GappedAlignments
autoplot(reads, show.junction = TRUE) + facet_grid(~seqnames)
for now this can fix faceting problem, I will look into the weird "y" problem and release a fix sometime this week.
Thanks!
Tengfei
On Wed, Apr 18, 2012 at 11:22 AM, Jeremy Leipzig < reply@reply.github.com
wrote:
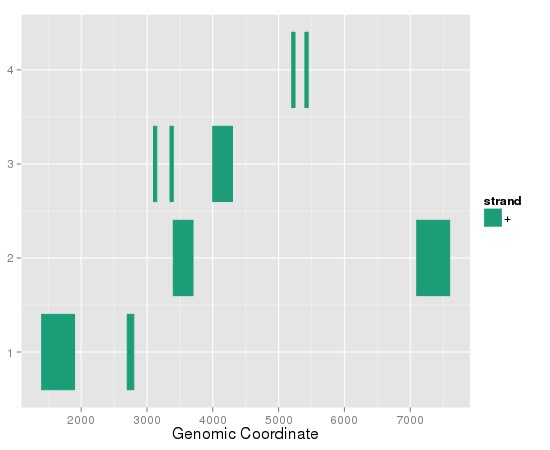
reads <- GappedAlignments(
  names = c("a","b","c","d","e","f","g"),
  seqnames = Rle(c(rep(c("chr1", "chr2"), 3), "chr1")),
  pos = as.integer(c(1400, 2700, 3400, 7100, 4000, 3100, 5200)),
  cigar = c("500M", "100M", "300M", "500M", "300M", "50M200N50M", "50M150N50M"),
  strand = strand(rep.int("+", 7L)))
there is something screwy with this plot - I can't see the chromsomes or the names, and I have no idea what the y-axis is supposed to be
Reply to this email directly or view it on GitHub: https://github.com/tengfei/ggbio/issues/19
Tengfei Yin MCDB PhD student 1620 Howe Hall, 2274, Iowa State University Ames, IA,50011-2274 Homepage: www.tengfei.name


 leipzig
there is something screwy with this plot - I can't see the chromsomes or the names, and I have no idea what the y-axis is supposed to be