leeoniya / uPlot

📈 A small, fast chart for time series, lines, areas, ohlc & bars
MIT License
8.51k stars 371 forks source link

consider drawing axis ticks on the canvas #112

Closed leeoniya closed 4 years ago

leeoniya commented 4 years ago

would reduce the need to add scale padding in userland (#71) and improve tick alignment and tick width mis-matches as seen in https://github.com/leeoniya/uPlot/issues/108#issue-556574253.

EDIT: might not be feasible, since there can be multiple axes on a single side, which also need ticks, but would not be adjacent to the canvas. drawing everything on canvas is a bigger undertaking.

leeoniya commented 4 years ago

...unless we also draw axes & labels on canvas, which might be good for perf since we don't need to touch dom. also might help with exporting images of chart.

function getLines(ctx, text, maxWidth) {
    var words = text.split(" ");
    var lines = [];
    var currentLine = words[0];

    for (var i = 1; i < words.length; i++) {
        var word = words[i];
        var width = ctx.measureText(currentLine + " " + word).width;
        if (width < maxWidth) {
            currentLine += " " + word;
        } else {
            lines.push(currentLine);
            currentLine = word;
        }
    }
    lines.push(currentLine);
    return lines;
}
function getLinesForParagraphs(ctx, text, maxWidth) {
  return text.split("\n").map(para =>
    getLines(ctx, para, maxWidth)
  ).reduce([], (a, b) => a.concat(b));
}

simple text wrapping impl: https://stackoverflow.com/a/16599668
leeoniya commented 4 years ago

i'm currently prototyping this, which should bring some perf improvements due to less dom generated for labels & axes - 0 to be exact. this will keep the GC happier for data streaming and reduce mem usage when creating many plots at once. it also reduces the need for #71 and makes the story for #20 much better.

the html structure will be simplified and flattened, as will the CSS.

<div class="uplot">
  <div class="title">Title</div>
  <div class="plot">
    <div class="under">below canvas stuff</div>
    <canvas>plot, gutters & axes</canvas>
    <div class="over">cursor, hover points, tooltips, selection</div>
  </div>
  <div class="legend">Legend</div>
</div>

dom layout demo:

https://codepen.io/leeoniya/pen/WNvwxBb?editors=1100

cc @ldstein @danyalejandro @CrashLaker @dgl @silverwind @stuck1233333

leeoniya commented 4 years ago

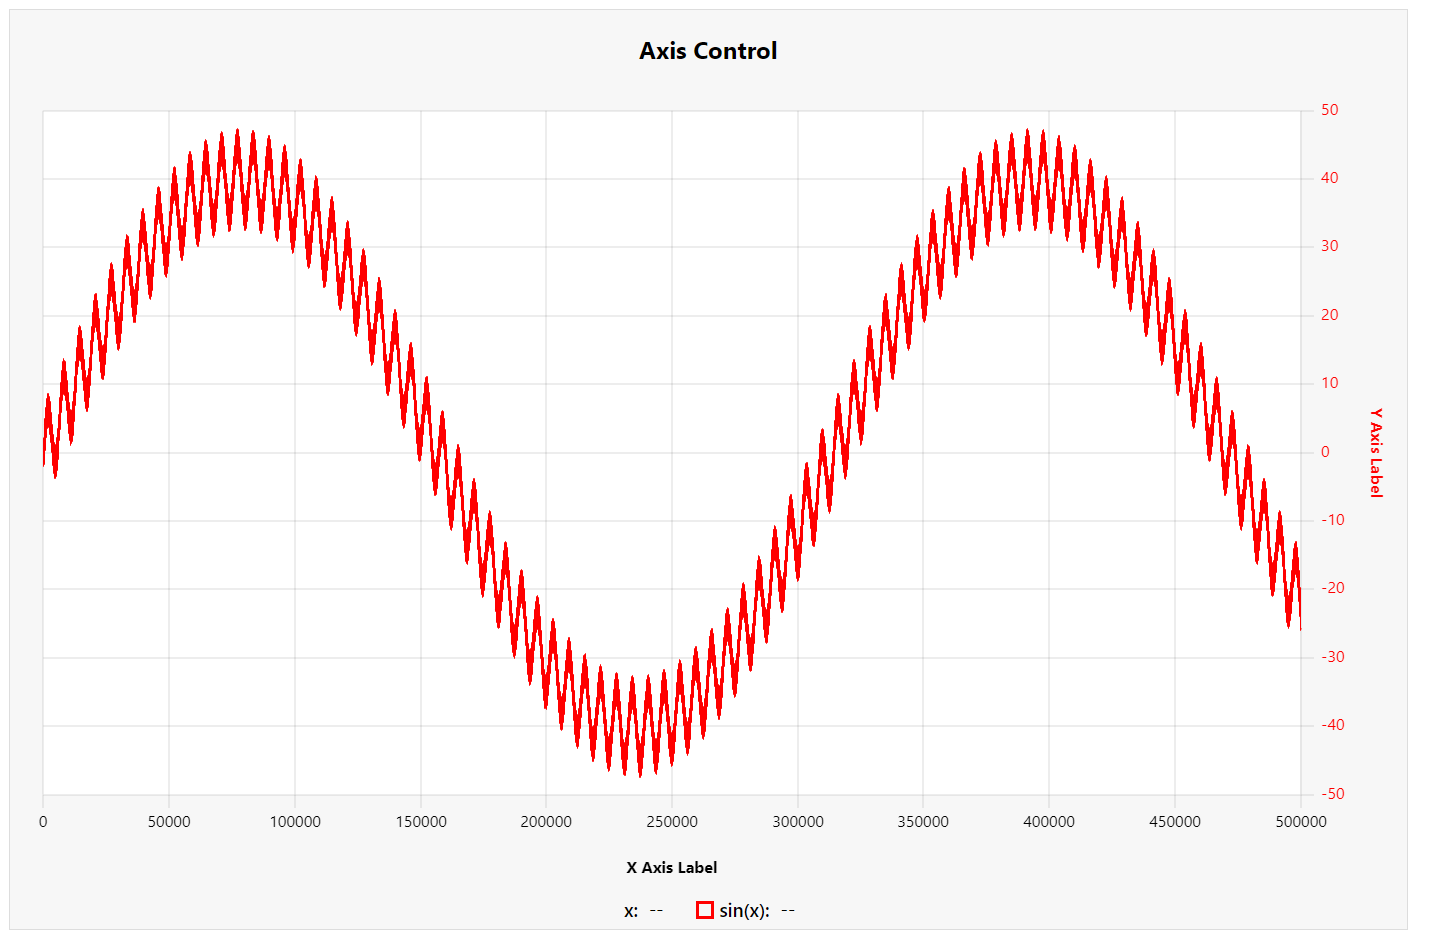
it's been a lot of work, but i've made good progress and the results are promising - tick alignment is now perfect and markers at plot extremes will not be cut off.

so far i've only validated basic rendering, cursor movement/zoom, axis & label placement. there's still work to do on testing resizing, multi-line tick labels, ensuring the APIs work as before and validating + updating all the demos (should be minimal).

right now the js code is a bit larger than the DOM version, but the css is smaller by the same amount. there's still a lot of DRYing left to do, too.

wip

silverwind commented 4 years ago

Does this mean that text is drawn statically on the canvas? If so, wouldn't that take away a lot of customization options regarding fonts and such?

I'd certainly prefer if ticks are drawn in the canvas because of mentioned padding issue, ideally configurable in their size.

leeoniya commented 4 years ago

Does this mean that text is drawn statically on the canvas? If so, wouldn't that take away a lot of customization options regarding fonts and such?

yes, i'll expose axis.font: {size, family, weight, stroke}, but nothing fancier. there's also going to be a new axis.tick: {show, size, width, stroke, dash, gap} - bascially grid, plus .gap (to shift the labels out).

I'd certainly prefer if ticks are drawn in the canvas because of mentioned padding issue

i lied. the issue with hover-point clipping is not fully resolved by this because the hover points are dom-based, and the way i currently hide them (and the cursor) it to give them neg coordinates (their container is overflow: hidden) - which still clips its contents at its bbox. if i leave overflow: visible, then it solves the issue (kind of) as long as i hide the cursor and hoverpoints with display: none or something - but that's more state tracking and dom-fiddling than simple setting the position to off-screen. i need to think more about it.

i should have the canvas changes pushed in the next few days.

silverwind commented 4 years ago

Question regarding the gray area behind the ticks in your screenshot above: Is that part of the canvas transparent or are you rendering a static background color on that strip? If static, it should be configurable.

leeoniya commented 4 years ago

the gray bg and outline on .uplot and white bg on .under are just set in css for this demo. i use it to visualize the bounds of everything to get the positioning & spacing right. there are no default backgrounds on anything, so it's all transparent.

leeoniya commented 4 years ago

one side-effect of this change is that u.ctx.canvas.width is no longer representative of the plotting area, since it includes the axes. this is useful for plugins that want to draw on the canvas directly. you can still technically reverse engineer/parse it from the style applied to .over and .under, but it's not a particularly pleasant exercise. i'll be exposing a u.bbox: {left, top, width, height} that holds the coords (in canvas pixels) of the plotting area. i'm not too thrilled with vagueness of the property name but couldn't think of anything short that made things more clear: .plot, .rect, .area. willing to evaluate other short suggestions!

another thing i ran into when porting the demos is that it's not possible to invoke a cross-hooks global canvas state to affect the grid but not the axes & labels. e.g. the draw-hooks demo applies a ctx.filter() to blur the grid.

https://github.com/leeoniya/uPlot/blob/dd07c04deb504a2148ec11a81db10035ce1e98c8/demos/draw-hooks.html#L37-L54

i'm not particularly concerned with losing this since i think it's super niche. the only use for blur that i can think of drawing a bg image and blurring it, but this can already be done in the drawClear hook.

i may add a separate drawAxes hook, since drawGrid now [confusingly] includes drawing the axes. so it may become possible again.

danyalejandro commented 4 years ago

i'll be exposing a u.bbox: {left, top, width, height} that holds the coords (in canvas pixels) of the plotting area.

Thank you for this. I'm currently drawing a second canvas over yours as a second data layer and depend on these coords. "bbox", "bounds", "area", "innerArea" would be easy to understand for me.

leeoniya commented 4 years ago

ok, the changes have landed. very terse rundown of the new/changed stuff:

u.bbox:         coords of plot region, in canvas px
  left
  top
  width
  height

opts.axis:
  font         "12px Roboto"
  labelFont    "bold 12px Roboto"
  gap           space between ticks and labels, in css px
  tick
    show
    width
    stroke
    dash
    size        length of tick, in css px
ldstein commented 4 years ago

Nice work, looks good.

Agree with you regarding the drawGrid, drawAxis changes.

Personally, I'd like to see a drawGrid fire after all axis are drawn. That would makes it much easier to draw above the grid.

Adding drawGrid would also fix a bug in the draw hooks demo (if you zoom in too far, only a single axis is drawn and the blur is not turned off).

leeoniya commented 4 years ago

Personally, I'd like to see a drawGrid fire after all axis are drawn.

drawAxes (formerly drawGrid) already fires after the axes & grid are drawn, so you can draw over the grid at that point (as long as you stay within u.bbox bounds to not draw on top of the axes). the only loss in functionality here is the inability to apply a global canvas operation like filter in drawClear because it will affect both the axes and grid. if you look at how the draw code is structured internally, there's actually no separate passes to draw these things. the grid is drawn based on the axis where it is defined - so, incrementally. i disabled the blur for now. it's interesting, but i'll live without it.