leeoniya / uPlot

📈 A small, fast chart for time series, lines, areas, ohlc & bars
MIT License
8.51k stars 371 forks source link

draw a horizontal line in the chart #203

Closed hengfengli closed 4 years ago

hengfengli commented 4 years ago

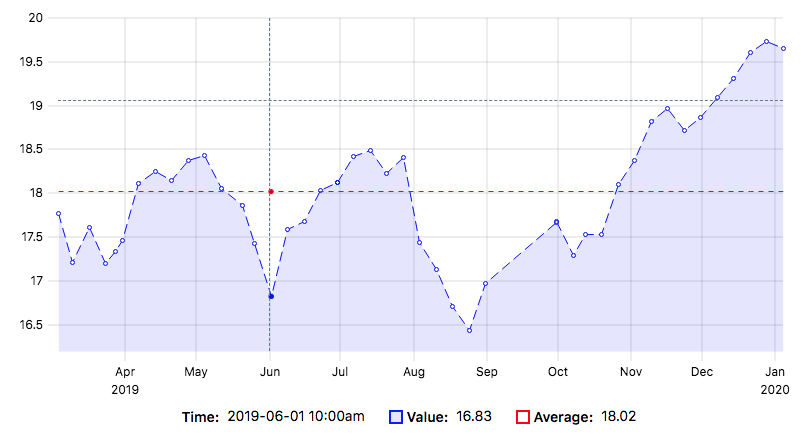
Hi, I wonder if it is possible to draw a horizontal line, like this:

Screen Shot 2020-05-08 at 11 04 32 pm

BTW: The rending speed is super fast. I really like your work.

leeoniya commented 4 years ago

hey @hengfengli

you can draw whatever you need directly on canvas.

for annotations that should be drawn an the end of the draw cycle (on top of everything) you can use the draw hook. otherwise you can use drawClear (under axes & grid), drawAxes (over axes & grid) and drawSeries (over any series) to draw into specific "layers".

e.g. the renderStatsPlugin or seriesMediansPlugin in https://leeoniya.github.io/uPlot/demos/draw-hooks.html

hengfengli commented 4 years ago

I found a solution in https://github.com/leeoniya/uPlot/blob/master/demos/trendlines.html and have a chart like this:

Screen Shot 2020-05-09 at 8 49 56 am

Is there any option in series to disable showing "circles" for each data point?

leeoniya commented 4 years ago

Is there any option in series to disable showing "circles" for each data point?

series.points.show: false should do it.

https://github.com/leeoniya/uPlot/blob/93e14e2fac297d11723df8e5c140606e2354615a/dist/uPlot.esm.d.ts#L312-L314

hengfengli commented 4 years ago

Looks much better now:

Screen Shot 2020-05-09 at 9 01 43 am

It would be nice if I can disable the cursor on a single series.

        {
          label: "Average",
          stroke: "red",
          // the following part does not work right now. 
          cursor: {
            points: {
              show: false,
            },
          },
          ////////////////
          points: {
            show: false,
          },
          dash: [5,5],
          value: (self, rawValue) => rawValue.toFixed(2),
          spanGaps: true,
        },
leeoniya commented 4 years ago

It would be nice if I can disable the cursor on a single series.

this is a sign that we're abusing series for what should actually be a static annotation drawn on canvas :). i still think the proper implementation here is to do what the renderStatsPlugin and seriesMediansPlugin do in the draw hooks demo - i'm thinking i'll redo the trendlines demo to work this way.

in any case...the cursor points are in the DOM, so you can use css to hide them.

hengfengli commented 4 years ago

I agree. Anyway, thanks for replying. Really nice work!!! 💯

leeoniya commented 4 years ago

check out the revised trendlines code:

https://github.com/leeoniya/uPlot/blob/master/demos/trendlines.html

hz2018tv commented 3 years ago

do we have a demo where a simple horizontal line is drawn on the canvas and there are buttons to click to move that line up and down? I have a case where I want to be able to draw some straight lines then move them up/down or remove/add some lines

leeoniya commented 3 years ago

there is no demo of exactly what you're asking, but the trendlines demo has very straightforward code for what is necessary to draw lines on the chart. hopefully you can figure out how to make them horizontal.

if you need to make buttons to move your lines, you'll want to call .redraw() so that your code can be re-triggered to draw them in the new location.

https://github.com/leeoniya/uPlot/blob/ccd59500c90fc8d2ef0d237f250e2918e9972eb1/dist/uPlot.d.ts#L53-L54

hz2018tv commented 3 years ago

tried to call .redraw(), seems the function call itself passed, but the canvas was not updated. searched demo, didnt find any one that shows how to call redraw(). could you use OHLC demo as a sample, then draw a random horizontal line, then delete that line or move that line to another random place after 5 sec?
I was drawing the line with (x0,y0,x1,y0), then I call u=new uPlot(), with desired plotting showed up, then I changed the cords to (x0,y1,x1,y1), then call u.redraw(), nothing changed...console logs show everything went well....

leeoniya commented 3 years ago

are you looking to draw the line at a specific value along the y scale (and need it to respect zooming in/out?)

hz2018tv commented 3 years ago

any random line along the y scale will work, no need to worry about zooming in/out. just want to see a sample on how to call redraw() or how to move/remove a line plotting. thanks!

btw, is there a setData() for line drawing hooks? I played around the code a little bit and found the line drawing function is called all the time with old cords, so if there is a function to update the cords then the drawing will be updated, thus no need to call redraw of the whole canvas? my case is to put some lines on an OHLC chart and move/remove them if needed.

leeoniya commented 3 years ago

https://jsfiddle.net/cxtb4kju/4/

let now = new Date() / 1000;
let data = [
  [now++,now++,now++,now++,now++,now++],
  [3,4,5,6,7,8],
];

const opts = {
  width: 600,
  height: 300,
  title: "Area Fill",
  series: [
    {},
    {
      stroke: "red",
      fill: "rgba(255,0,0,0.1)",
      spanGaps: true,
    },
  ],
};

let u = new uPlot(opts, data, document.body);

let { bbox, ctx } = u;

let yVal = 3;

setInterval(() => {
  // false is for perf (prevents series' paths rebuilds)
  u.redraw(false);
  let yPos = u.valToPos(yVal, 'y', true);
  ctx.beginPath();
  ctx.strokeStyle = "blue";
  ctx.lineWidth = 1;
  ctx.moveTo(bbox.left, yPos);
  ctx.lineTo(bbox.left + bbox.width, yPos);
  ctx.stroke();
  yVal += 0.1;
}, 200);
hz2018tv commented 3 years ago

I made a linePlugin as followings

function linePlugin(){
  function init(u, opts) {
    copts=opts.lineOpts
  }

  function drawLine(u) {
    for(i=0;i<copts.lines.length;i++){
      console.log(copts.lines[i])
      //drawing with ctx moveTo,lineTo, etc
    }
  }

  return {
    opts: (u, opts) => {
    },
    hooks: {
      init: init,
      draw: drawLine,
    }
  };
}

so, the first time init() was called with old cords and drawLine() did the job, then how do I update the copts which new cords defined in opts.lineOpts.lines? the console.log shows the drawLine() is called all the time with old cords. is there a setData() for the hooks?

leeoniya commented 3 years ago

https://jsfiddle.net/3pLnza2h/

hz2018tv commented 3 years ago

got it. tested in my code and worked. so passing the opts as a param to the plugin did it. thanks a lot! btw, are there other ways to pass changes to the plugin,i.e, via setData() sort of method?

leeoniya commented 3 years ago

btw, are there other ways to pass changes to the plugin,i.e, via setData() sort of method?

no, and i'm not even sure how that would work since you'd want to somehow target the specific plugin within the plugin array (i guess by passing an index or a plugin function?). it's easier to just make some wrapper component around uplot that exposes any methods you need to update plugin states. js's closures and semantics are powerful enough where this isn't strictly necessary to add to the core API, imo.

EDIT: actually this wouldn't even be possible since plugins just decompose to hooks. and uplot has no knowledge of what data the hooks act upon, which in the case of plugins are typically inside the plugin closure (or external, like here).

hz2018tv commented 3 years ago

as you can see, I made that lineplugin with the same logic as the candlestick plugin. havent seen any ways to modify data to candletick plugin either. maybe you are right, maybe in the u structure somewhere we can add a handle to track customer objects. I am not versed in js. just a thought

leeoniya commented 3 years ago

havent seen any ways to modify data to candletick plugin either.

the candlestick plugin reads from data, so updating the candlesticks works via .setData().

you can tweak the linesPlugin so it pulls the lines from data as well and updates via .setData().

https://jsfiddle.net/97fzmpgu/

.setData() will always rebuild the series paths so the perf might be worse, but the ohlc plugin doesnt use series paths anyways, so in this case there would be no difference.

hz2018tv commented 3 years ago

in your sample above, could you make one line solid and one line dashed? I tried to call setLineDash before and after beginPath(), but I am getting eiterh solid or dashed, but not mixed. thanks.

leeoniya commented 3 years ago

please ask general Canvas-related questions on stackoverflow, since uPlot has nothing to do with how you handle direct canvas interaction. thanks!