leeoniya / uPlot

📈 A small, fast chart for time series, lines, areas, ohlc & bars
MIT License
8.51k stars 371 forks source link

Rotate chart #279

Closed choma closed 3 years ago

choma commented 3 years ago

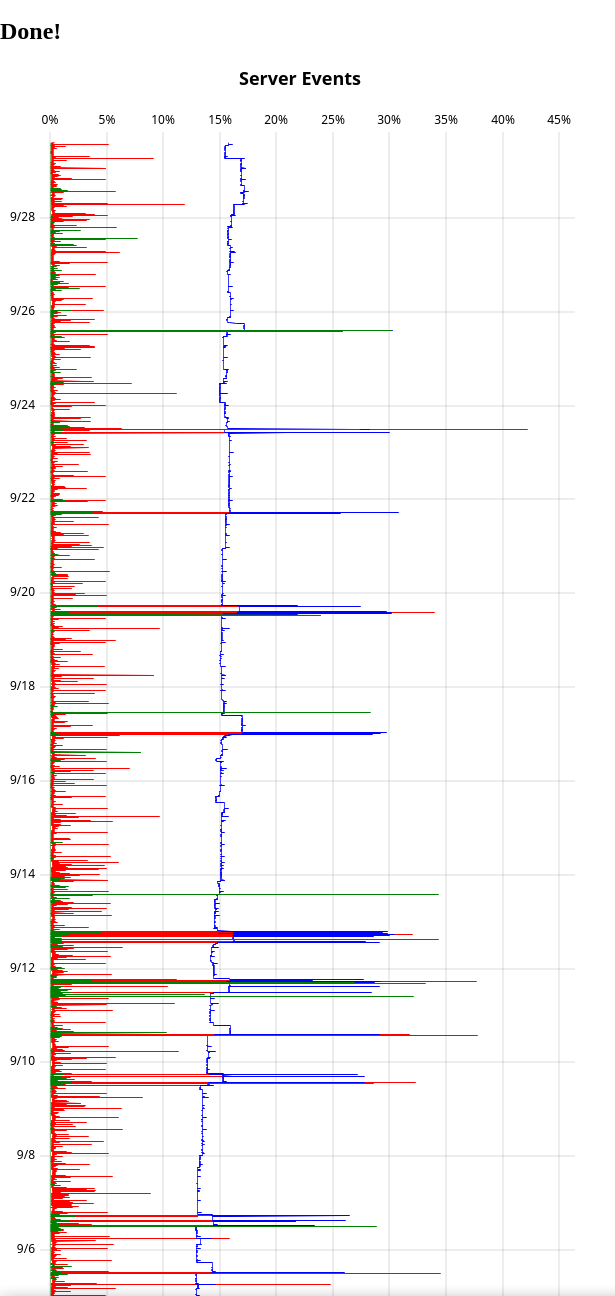
We are testing uPlot in a project that draws hundreds of thousands of data points, and it works great. A requirement of the project is that the chart needs to be "rotated", I mean, the x axis is the vertical axis, like this Echart example.

I'm currently trying to do this by rotating labels and then rotating the canvas. It kind of works, but label rotation is only supported in the x axis.

Is there an easier way to do this?

leeoniya commented 3 years ago

hey @choma

that's interesting. can you post a jsfiddle example with your config and some basic data. initially i was gonna dismiss this whole thing as impossible, but thinking about it more makes me wonder how far it can get without issues by simply overriding axis.side (i assume?).

if the only issue is the side restriction for label rotation, this should be fairly easy to address.

EDIT: sorry i just-re-read what you wrote. you're rotating the canvas. so yeah the only issue would be label rotation in that case, though i imagine any kind of cursor interaction, hover points and zooming will be broken. so this is for a static chart.

leeoniya commented 3 years ago

what i was wondering if this "rotation" can be supported natively by simply swapping some scale and side options.

it doesn't quite: https://jsfiddle.net/qyjsbLzm/1/

i'm not sure how many internal assumptions would need to be tweaked to make this work, but it seems like a good thing to look into. i would prefer to solve rotation properly (like this) instead of adding label rotation to other axes as a half-hack that still leaves the interaction completely busted.

choma commented 3 years ago

I was trying something like this:

https://jsbin.com/zihuxaqumo/edit?js,output

The drawing looks ok, but the interactions is obviously broken

leeoniya commented 3 years ago

since this is a fairly niche use-case and the changes needed are likely not trivial, chart rotation is not at the top of my priority list; i'm going to release v1.1 hopefully in the next few days, then start plugin cleanup & #184 next.

you may have to settle for a horizontal x until i get to this, or use another lib if chart rotation is critical to your app.

choma commented 3 years ago

Thanks for the quick answer @leeoniya. We will evaluate our options, but we are going to keep an eye on this library in any case.

1nv1 commented 3 years ago

The possibility of rotate the chart would be great! That feature is very used in many academics and hobbyists areas. Regards.

leeoniya commented 3 years ago

the thing in my mind that this would be most useful for is actually horizontal bars. where the vertical "x" serves as a category axis and is often used in bar race charts. eg like a rotated version of the already-crowded perf chart [1].

@1nv1

That feature is very used in many academics and hobbyists areas.

can you please link to some example images where this is common? i cannot think of many practical cases when this would be anything more than a stylistic choice (in the case of hz bars it's mostly to maximize bar density without having to rotate long category labels). generally speaking, being common is not by itself sufficient for inclusion in uPlot, which will never support the flexibility of Chart.js and other larger libs. for instance, i've specifically avoided providing things like stacking and line smoothing because they're terrible for data insight, despite both being very common and looking nice.

[1] https://leeoniya.github.io/uPlot/demos/multi-bars.html

1nv1 commented 3 years ago

Hi @leeoniya! In general isn't very common that chart-libraries or chart-engines have the option to rotate the entire chart. Is very often that as user we choose that type of representation. I hear about some new audio-processing software come with this way to display tracks where axis time is vertical, for example. Also in signals processing theory this way of representation is appreciated, it's very practical. The problem as user is find some 'hack' to put the chart in 90° degrees, sometimes is possible, in general the tools are unable to do that. I think is like a UML sequence diagram, is much comfortable that view. Today, we measure many physics variables and this way of representation is helps to see them all at once. I took a screenshot from my work. The most used charts in my work is in this format. Thank for your response and time. Regards. 02

leeoniya commented 3 years ago

notes for future self:

this will require adding orientation and directionality awareness to scales: scale.ori: 0|1 & scale.dir: +1|-1. the axes will then infer their default side-ness based on the scale they're linked to (simply setting axis.side is insufficient since all scale-based ops need to know which way to go and offset).

.u-cursor-x and .u-cursor-y have hardcoded css rules which expand them to the plot width/height. this will have to be pulled into style props or additional .hz and .vt classes.

gutters.x & gutters.y assume width/height/left/right. also, a lot of the gutter and axis spacing defaults assume a specific orientation and typical label properties / lengths to avoid collisions and provide a reasonable density, which will need to change if e.g. a time axis becomes vertical.

there are probably some assumptions based on testing against xScaleKey that use width or left offsets which will need to change to use the scale orientation and direction.

kpbieber commented 3 years ago

Attempting to get this working and wanted to chime in with a use case that may apply:

In my case my customer is in drilling, and it is common in that industry to want to orient your charts with time (or depth) on the Y-Axis, and various pressures, weights, torques, and rates as the X-Axis. That way you can intuitively see the job progressing from shallow (near the top of the chart) to deep (bottom of the chart).

Here is a related image ripped from google WellView_Schematic_2560x1440

In my case, a chart is generally several related time series data, but I would like to just have once check box for "invert" in our configuration dialogs for the portion of our customers that are just used to seeing it oriented that way.

leeoniya commented 3 years ago

it might be easier to accomplish this via some less intrusive changes.

if we pretend that we'd just use CSS's native transform: rotateZ(90deg), then add a bit of code to invert x/y positions for cursor interactions and width/height for the bounding box, and allow the y labels to be rotated (currently only bottom x rotation is supported), and disable the chart title and legend, then we may have something that can technically work without breaking any major assumptions that uPlot requires. it may also be achievable by doing a canvas context rotation.

i'm leaving this open cause i do want to experiment with this at some point.

leeoniya commented 3 years ago

turns out this has more uses than just vertical lines. horizontal bars and histograms can also use this. i've decided to work on this, so it should make it into the next release. the first part (scale direction) is implemented in https://github.com/leeoniya/uPlot/commit/6ab82eb4b490e83d677a8f671a5ca786ef3464ed. the next part (scale orientation) will land sometime before the end of the year.

1nv1 commented 3 years ago

Amazing news!

leeoniya commented 3 years ago

progress...

image

leeoniya commented 3 years ago

this is now fully supported in uPlot 1.6: https://leeoniya.github.io/uPlot/demos/scales-dir-ori.html

kfilyk commented 1 month ago

Just found this thread. Just what I was looking for! Thank you leeoniya, great library