 leeoniya
commented
4 years ago
leeoniya
commented
4 years ago awesome, thanks for testing! might be useful to add these additional numbers to a wiki page here :)
let me know if any of uPot's API is counter-intuitive, i'd like to get as much of it polished before 1.0. still have to do a lot of docs! https://github.com/leeoniya/uPlot/issues/48
 rubyzhao
 CrashLaker
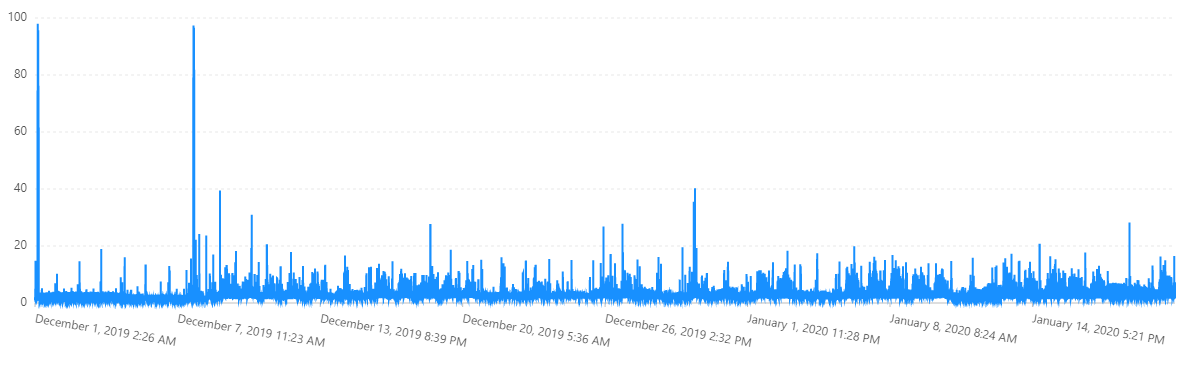


 alexey-milovidov
This isn't a issue. I just want say thanks. Hope more people use it.
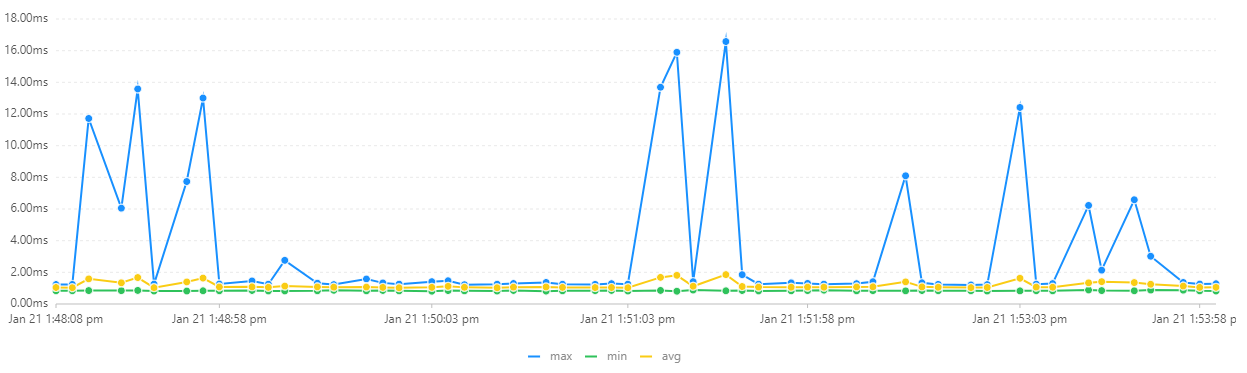
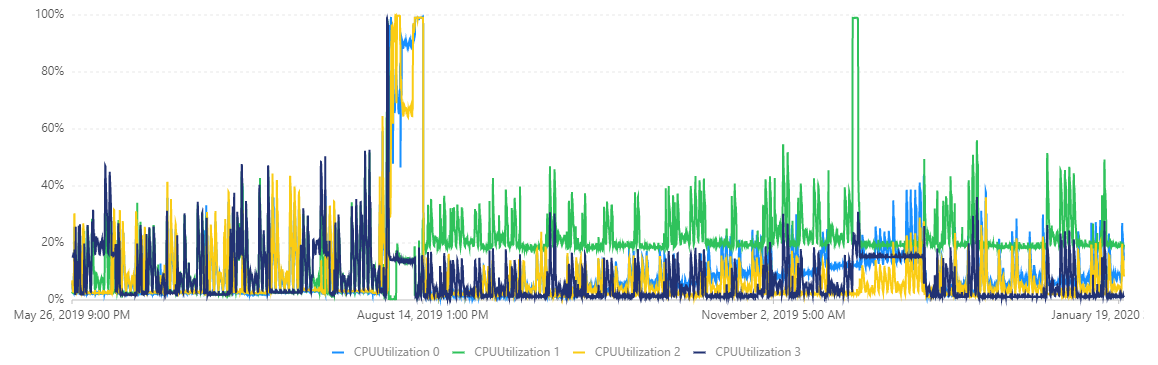
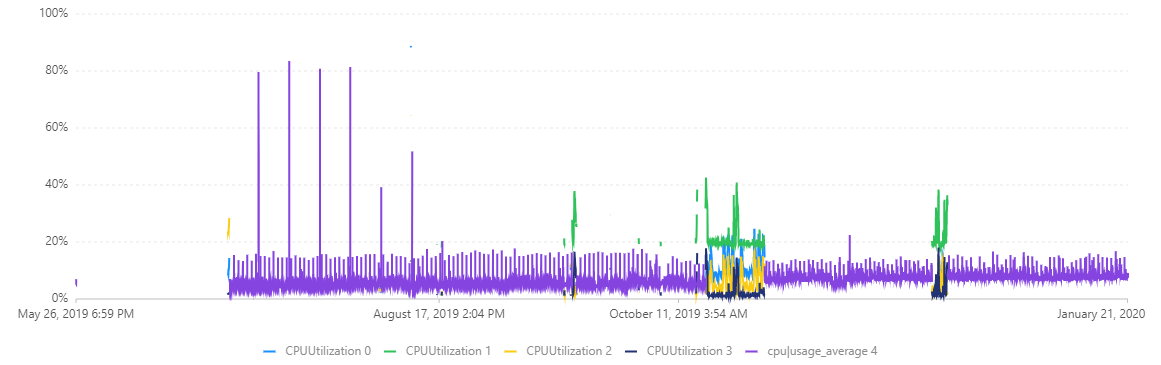
To select the best line chart package for my project, especially when points are about 2 millions. uPlot becomes No.1. Even it is fast than direct lineTo for Canvas. It is amazing. Thanks for the great work. Please see the detail at https://github.com/rubyzhao/LineChartPerformanceCompare