 ghost
commented
2 years ago
ghost
commented
2 years ago Right clicks work here:
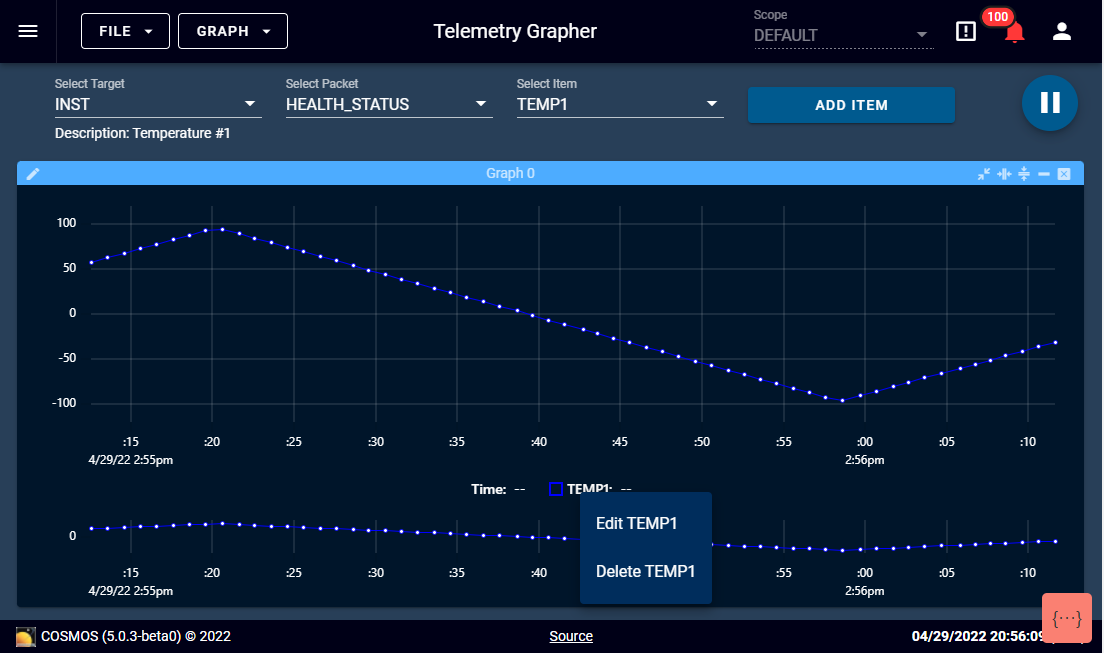
But not here:

When I re-expand the graph to the full-size the right click handler works again.
Closed ghost closed 2 years ago
ghost
commented
2 years ago Right clicks work here:
But not here:
When I re-expand the graph to the full-size the right click handler works again.
 leeoniya
commented
2 years ago
leeoniya
commented
2 years ago It's as if the event listener has been removed. This is weird because the .u-legend that I'm attaching to hasn't gone away.
i agree, that is super weird. there's nothing in uPlot that recreates or touches the legend wrapper after init. happy to help you debug it if you have a live version somewhere, but otherwise i won't be much help.
ghost
commented
2 years ago Unfortunately no. The contentmenu listener on the .u-over doesn't seem to be affected. Is there anything I can hook into to help debug?
leeoniya
commented
2 years ago series.item
that's not a uPlot thing, so :shrug:
there's 1M things it can be. try another browser, try display: none instead of 0 height. make sure the legend is not somehow detached from the DOM. try latest master. nothing obvious comes to mind.
here's a jsfiddle that works properly between every setTimeout, no listeners get detached from the legend: https://jsfiddle.net/mydv0tu4/
Unfortunately no. Is there anything I can hook into to help debug?
not that i can think of. it won't be feasible for me to debug this by reading partial chunks of code. please make a failing isolated repro in a fiddle and we can re-open.
ghost
commented
2 years ago I'll keep playing with it. It's interesting that it doesn't appear to respond to any mouse clicks. Like I can't select and deselect items from the legend either.
ghost
commented
2 years ago I added this code to my Vue component initializer:
  created() {
    var originalPreventDefault = Event.prototype.preventDefault;
    Event.prototype.preventDefault = function () {
      console.log(this)
      // Lookup specific event you're expecting, i.e. pressing space
      if (this instanceof PointerEvent) {
        // This will log an error with full stack trace
        make_error_to_see_stacktrace
      }
      originalPreventDefault.apply(this, arguments);
    };
  }
And I can see PointerEvent messages coming out when I'm expanded but they disappear when I'm small.
ghost
commented
2 years ago Found it! The overview graph's u-axis was invisibly sitting on top of my graph and absorbing the clicks (I assume). I need a better way to mark it as not-shown. I was simply calling setSize() with a height of 0 but that didn't affect the other graph elements.
leeoniya
commented
2 years ago if you dont need to interact with the axis bounding box, you can have it ignore all events by adding pointer-events: none; to it.
https://developer.mozilla.org/en-US/docs/Web/CSS/pointer-events
ghost
commented
2 years ago That worked like a champ! Thanks again.
I'm not sure why anyone would need to interact with the axis actually so maybe that's a good default?
leeoniya
commented
2 years ago I'm not sure why anyone would need to interact with the axis actually so maybe that's a good default?
it allows users to add event listeners to them without then wondering why they're not working. like you said, most people dont need to interact with them anyways so it doesnt affect them.
if you need to hide the whole chart, setting display: none is a much better option than trying to set a 0 height. and in that case you wont need to fiddle with axis css either.
I followed your advice in #422 to implement a legend event listener. This works great with a full size graph which has a little overview graph beneath it. However once I shrink the graph and set the overview graph height to 0 to hide it, it no longer works. It's as if the event listener has been removed. This is weird because the .u-legend that I'm attaching to hasn't gone away. The complete code in question can be found here.
Reproduced here for ease of discussion: