 aditya-malte
commented
5 years ago
aditya-malte
commented
5 years ago Hello, The output of the model can be converted to a heatmap by using matplotlib like this:
from matplotlib import cm plt.imshow(output , cmap = cm.jet )
This maps the raw [0,1] to H->[240, 0]. (H being hue from HSV).
PS. For your second doubt: The count values might vary a tiny bit due to the gaussian blur(this is because only an infinitely large kernel can approximate the gaussian blur accurately)
Thanks
 neverland0621
 wait1988
 SJLNNU
 xincmm
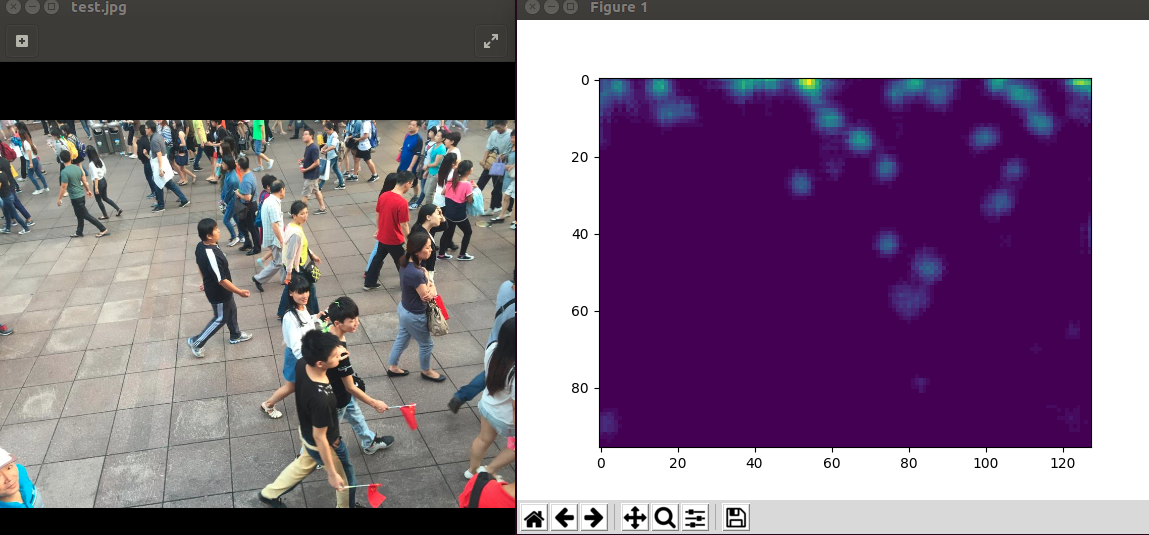
 hiramustafa77
Thank you for releasing the code. I have some questions about the source code. 1.How to generate the density map from the output of model?I didn't get the desity map from the output of the model when i run the val.ipython but only the groudtruth of density map.or ,how to transform the output of the model to densoty map?
print mse
I will appreciate the help if anyone has idea of the problem, thank you!