 houshym
commented
3 years ago
houshym
commented
3 years ago I have same issue but in Rancher provisioned cluster
Open longnnit opened 3 years ago
houshym
commented
3 years ago I have same issue but in Rancher provisioned cluster
 longnnit
commented
3 years ago
longnnit
commented
3 years ago ..
 willzhang
commented
3 years ago
willzhang
commented
3 years ago lens version:5.1.3 i have install everything, but i still can't see cluster cpu and memory, i don't what to do , and what i should do ,the officeal docs so easy ,nothing to say.
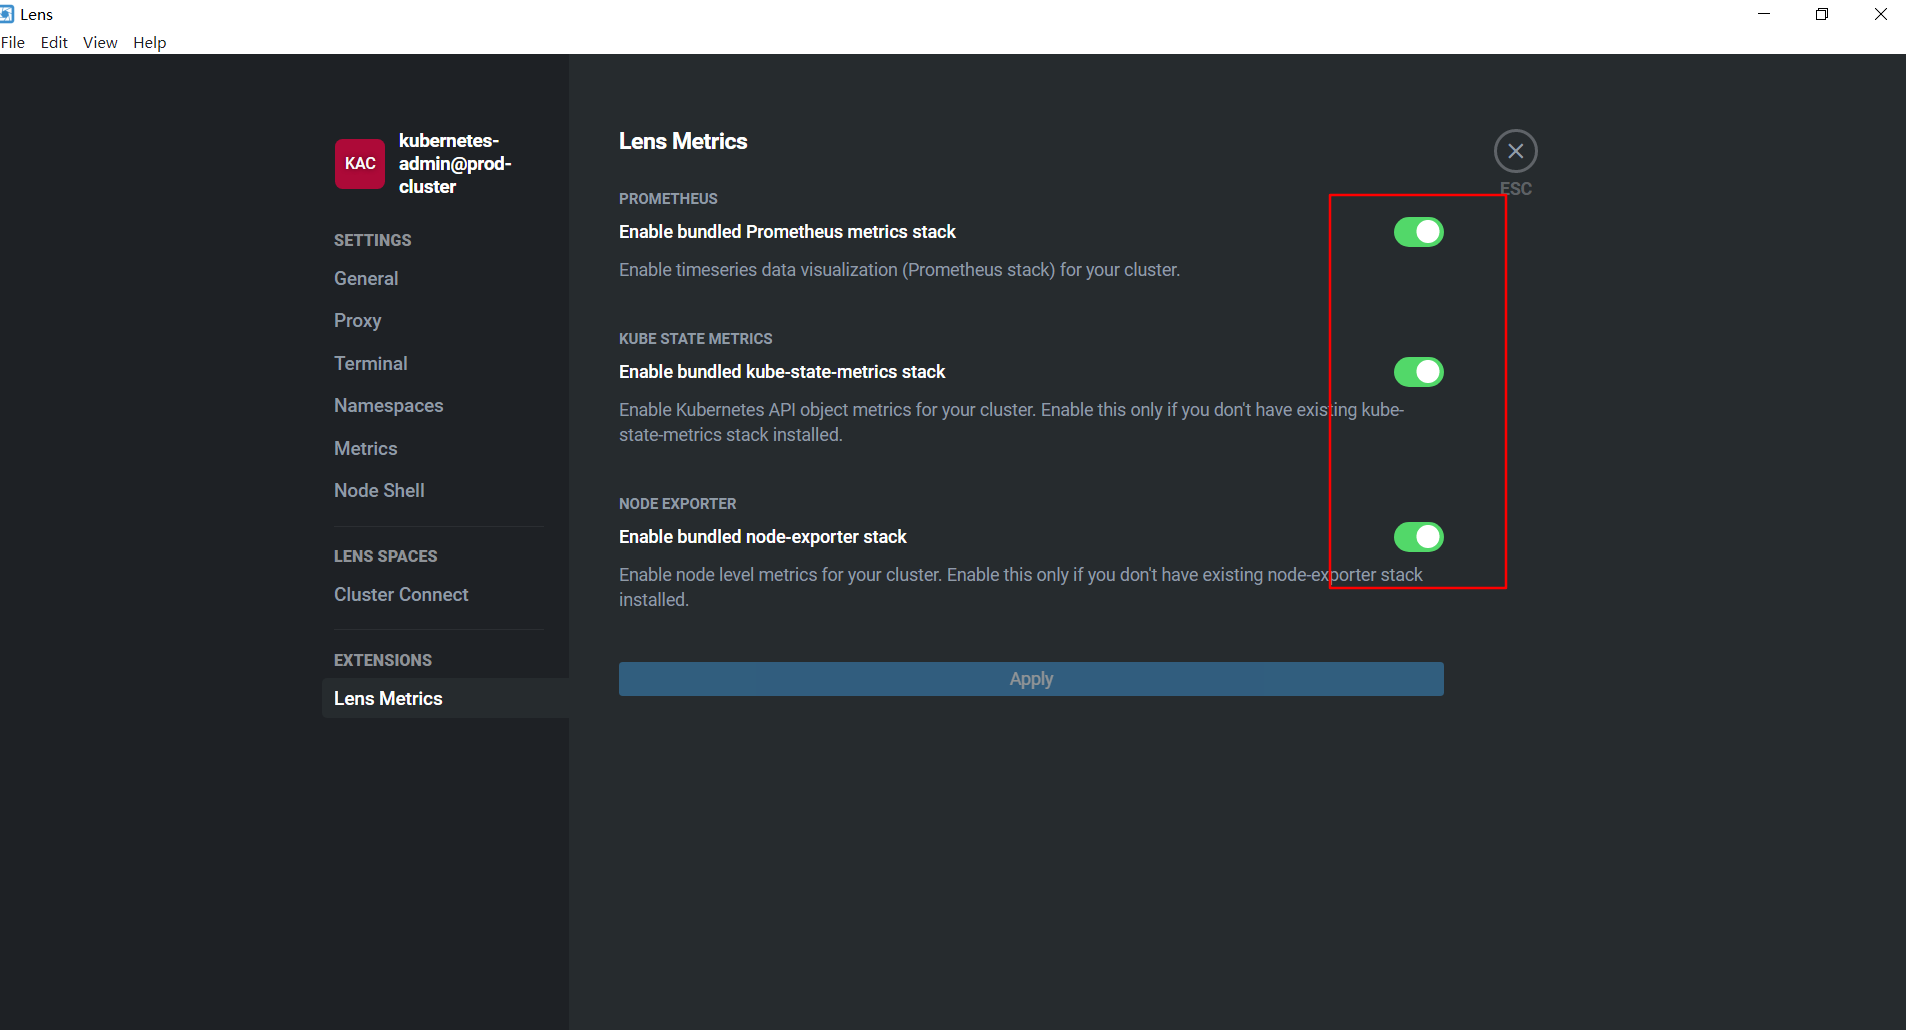
step one: install lens in windows step two: ? install metrics or prometheus ? should i choose which one? and why? how to install them ,how to config them for lens?
[root@kcs-prod-clust-s-rrfrb ~]#  kubectl -n lens-metrics get pods
NAME                                 READY   STATUS    RESTARTS   AGE
kube-state-metrics-8c77c5dd9-kw2mb   1/1     Running   0          10h
node-exporter-97vw6                  1/1     Running   0          11h
node-exporter-r6mkv                  1/1     Running   0          11h
node-exporter-wgtfj                  1/1     Running   0          11h
node-exporter-xnxbv                  1/1     Running   0          11h
prometheus-0                         1/1     Running   0          12h
service
[root@kcs-prod-clust-s-rrfrb ~]#  kubectl -n lens-metrics get svc
NAME                 TYPE        CLUSTER-IP     EXTERNAL-IP   PORT(S)    AGE
kube-state-metrics   ClusterIP   10.233.3.13    <none>        8080/TCP   12h
node-exporter        ClusterIP   None           <none>        80/TCP     12h
prometheus           ClusterIP   10.233.8.141   <none>        80/TCP     12h
error logs, see:https://github.com/kubernetes/kube-state-metrics#compatibility-matrix
# kubectl -n lens-metrics logs -f kube-state-metrics-8c77c5dd9-kw2mb
E0813 03:34:21.587651       1 reflector.go:138] pkg/mod/k8s.io/client-go@v0.20.5/tools/cache/reflector.go:167: Failed to watch *v1.CertificateSigningRequest: failed to list *v1.CertificateSigningRequest: the server could not find the requested resource
E0813 03:34:30.903595       1 reflector.go:138] pkg/mod/k8s.io/client-go@v0.20.5/tools/cache/reflector.go:167: Failed to watch *v1.Ingress: failed to list *v1.Ingress: the server could not find the requested resource
E0813 03:35:03.742139       1 reflector.go:138] pkg/mod/k8s.io/client-go@v0.20.5/tools/cache/reflector.go:167: Failed to watch *v1.Ingress: failed to list *v1.Ingress: the server could not find the requested resource
E0813 03:35:18.716370       1 reflector.go:138] pkg/mod/k8s.io/client-go@v0.20.5/tools/cache/reflector.go:167: Failed to watch *v1.CertificateSigningRequest: failed to list *v1.CertificateSigningRequest: the server could not find the requested resource
E0813 03:35:43.664199       1 reflector.go:138] pkg/mod/k8s.io/client-go@v0.20.5/tools/cache/reflector.go:167: Failed to watch *v1.Ingress: failed to list *v1.Ingress: the server could not find the requested resource
E0813 03:36:12.344254       1 reflector.go:138] pkg/mod/k8s.io/client-go@v0.20.5/tools/cache/reflector.go:167: Failed to watch *v1.CertificateSigningRequest: failed to list *v1.CertificateSigningRequest: the server could not find the requested resource
E0813 03:36:21.742068       1 reflector.go:138] pkg/mod/k8s.io/client-go@v0.20.5/tools/cache/reflector.go:167: Failed to watch *v1.Ingress: failed to list *v1.Ingress: the server could not find the requested resource
E0813 03:36:52.096666       1 reflector.go:138] pkg/mod/k8s.io/client-go@v0.20.5/tools/cache/reflector.go:167: Failed to watch *v1.CertificateSigningRequest: failed to list *v1.CertificateSigningRequest: the server could not find the requested resource
E0813 03:36:58.014301       1 reflector.go:138] pkg/mod/k8s.io/client-go@v0.20.5/tools/cache/reflector.go:167: Failed to watch *v1.Ingress: failed to list *v1.Ingress: the server could not find the requested resource
E0813 03:37:32.920331       1 reflector.go:138] pkg/mod/k8s.io/client-go@v0.20.5/tools/cache/reflector.go:167: Failed to watch *v1.CertificateSigningRequest: failed to list *v1.CertificateSigningRequest: the server could not find the requested resource
E0813 03:37:45.298671       1 reflector.go:138] pkg/mod/k8s.io/client-go@v0.20.5/tools/cache/reflector.go:167: Failed to watch *v1.Ingress: failed to list *v1.Ingress: the server could not find the requested resource
E0813 03:38:10.292299       1 reflector.go:138] pkg/mod/k8s.io/client-go@v0.20.5/tools/cache/reflector.go:167: Failed to watch *v1.CertificateSigningRequest: failed to list *v1.CertificateSigningRequest: the server could not find the requested resource
E0813 03:38:33.928752       1 reflector.go:138] pkg/mod/k8s.io/client-go@v0.20.5/tools/cache/reflector.go:167: Failed to watch *v1.Ingress: failed to list *v1.Ingress: the server could not find the requested resource
E0813 03:39:02.960875       1 reflector.go:138] pkg/mod/k8s.io/client-go@v0.20.5/tools/cache/reflector.go:167: Failed to watch *v1.CertificateSigningRequest: failed to list *v1.CertificateSigningRequest: the server could not find the requested resource
^C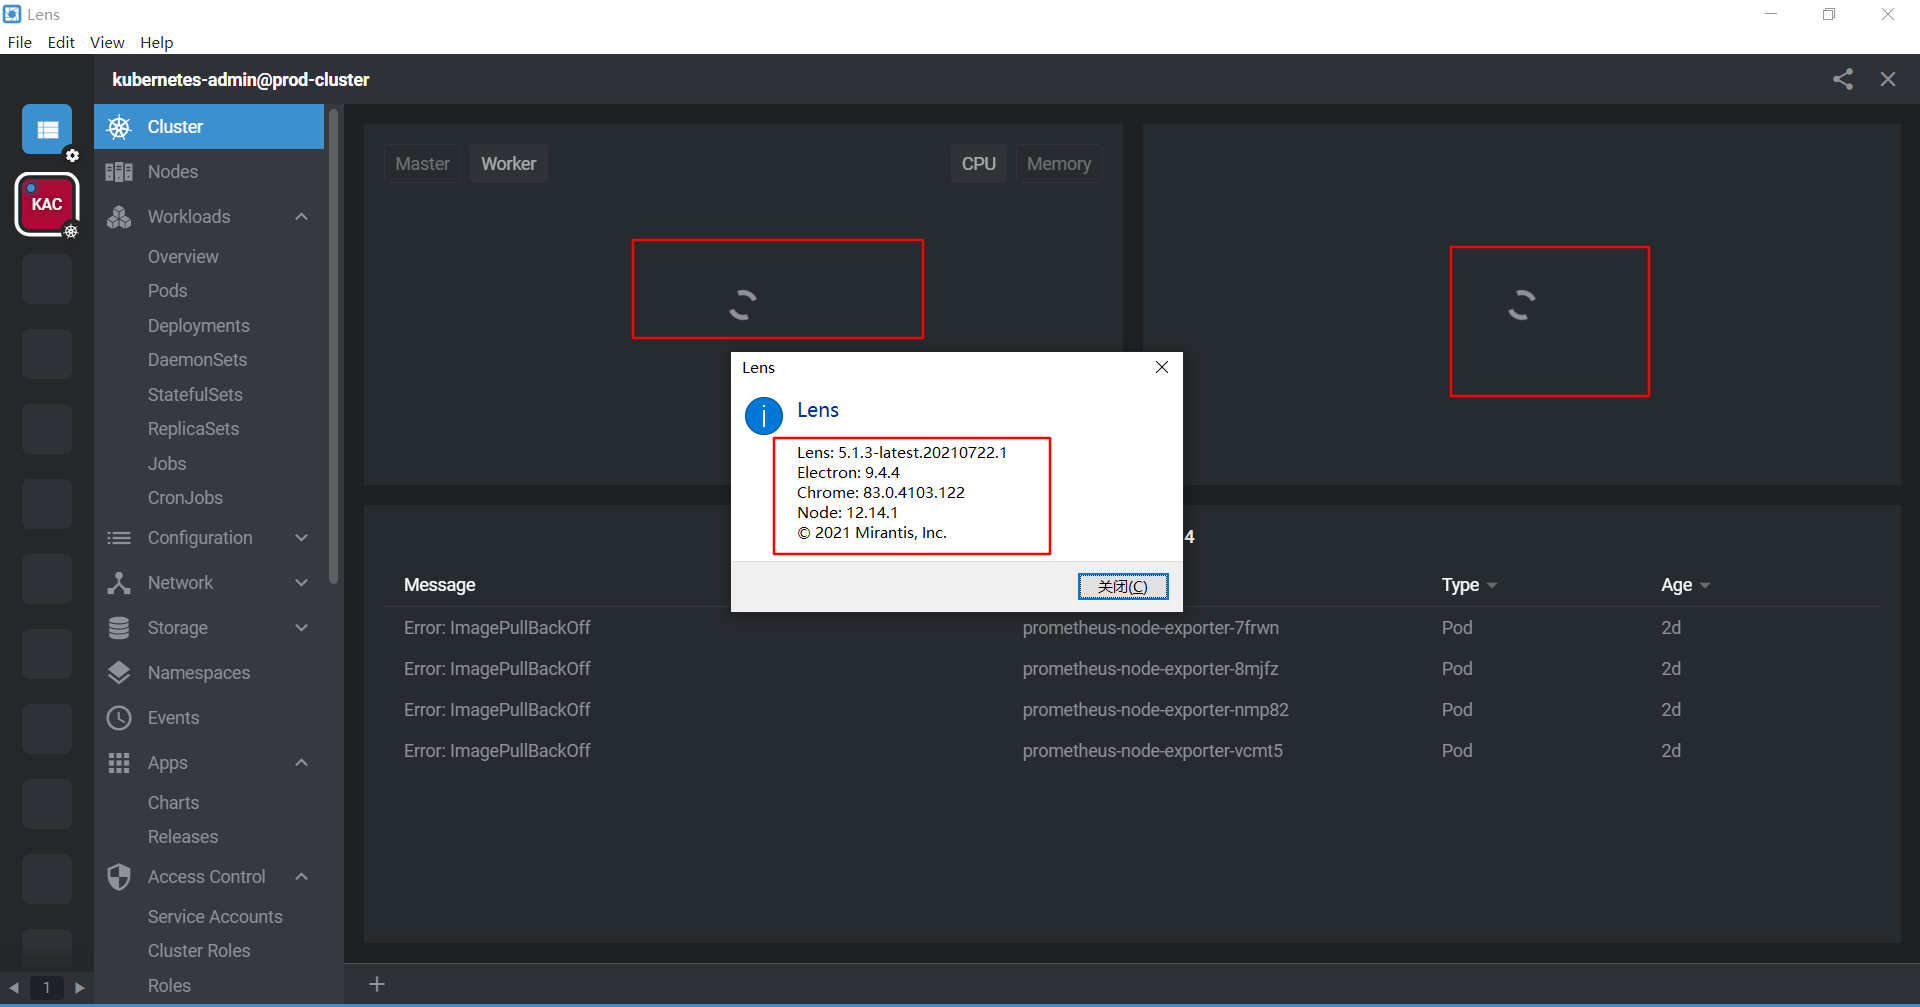
 lewijw
commented
2 years ago
lewijw
commented
2 years ago I'm seeing a similar issue with version 5.2.5-latest.20211001.2, but it was working at one point. Then, it stopped working. A restart of prometheus-0 did not help. Azure.
 devurandom
commented
1 year ago
devurandom
commented
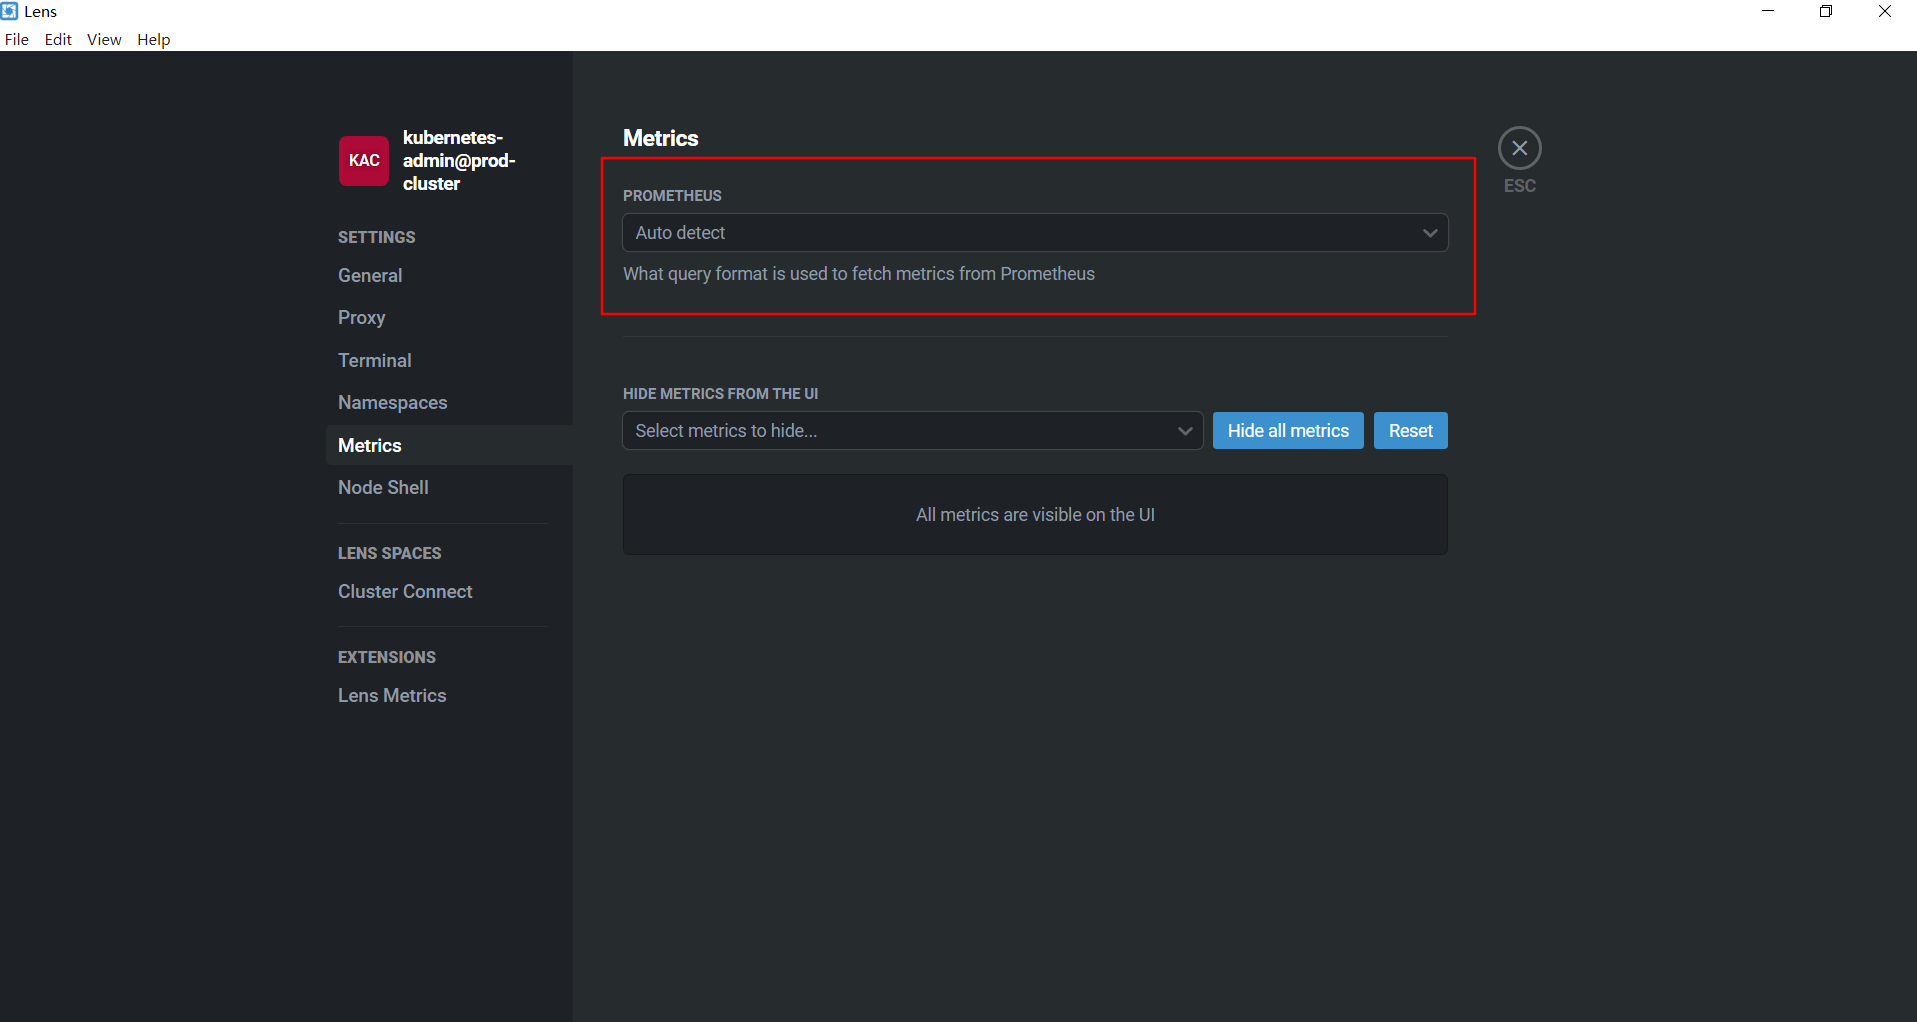
1 year ago Even when hand-holding OpenLens by going to Settings > Metrics and setting Prometheus = "Prometheus Operator" and Prometheus Service Address = the-namespace/the-service:the-port (I pressed Ctrl+R afterwards to make sure to reload the configuration) OpenLens tells me Metrics are not available due to missing or invalid Prometheus configuration. in the "Cluster" panel.
With kubectl port-forward -n the-namespace service/the-service the-port I can connect to https://localhost:the-port using my web browser, am redirected to /graph and see the Prometheus UI.
How do I debug this further? Which URL does OpenLens expect to be able to load?
 ylnsnv
commented
10 months ago
ylnsnv
commented
10 months ago Any news in this regard? I do not have the option on the settings to access extensions but I've made the metrics point the prometheus service properly and still can't see any metrics.
 odinxux
commented
9 months ago
odinxux
commented
9 months ago same issue.
i have two clusters old 1.21 works ok see all metrics
second 1.27 no metrics Prometheus , node exporter works but lens reports
Metrics are not available due to missing or invalid Prometheus configuration. Right click cluster icon to open cluster settings.
 sashati
commented
6 months ago
sashati
commented
6 months ago I have the same issue with version 6.5.2 and 6.10.33
 rameshvr
commented
6 months ago
rameshvr
commented
6 months ago We had same issue and resolved it by changing the prometheus repo we used. We were using
https://github.com/prometheus-community/helm-charts/tree/main/charts/prometheus and it was not showing metrics in lens.
Switched to https://github.com/prometheus-community/helm-charts/tree/main/charts/kube-prometheus-stack and now lens is showing visual data on metrics.
Ref - https://github.com/prometheus-community/helm-charts/issues/2321#issuecomment-1225291826
 ashishmahamuni21
commented
1 week ago
ashishmahamuni21
commented
1 week ago @rameshvr i am facing same issue even is i have deployed https://github.com/prometheus-community/helm-charts/tree/main/charts/kube-prometheus-stack
even if i have checked by installing kube-state-metrics as well Helm chart repo: https://prometheus-community.github.io/helm-charts Helm chart name: kube-prometheus-stack Helm chart version: 62.3.0 K8s version: 1.30.1
Describe the bug Metrics are not available due to missing or invalid Prometheus configuration. Right click cluster icon to open cluster settings.
I installed Lens v4.2.0 - Windows on Windows 10, and install Features metrics stacks in Setting, follow guide. Lens does not display k8s cluster charts (Master/Worker CPU/Memory) or the Nodes panel. I have used old Lens v3.6.9, Lens v4.1.5. I want Lens to display all of the information for my cluster.
To Reproduce Steps to reproduce the behavior:
Environment (please complete the following information):
Logs: 10.244.3.1 - - [02/Apr/2021:03:08:33 +0000] "GET / HTTP/1.1" 200 6 "" "kube-probe/1.17" {"level":"error","msg":"Error scraping node metrics: the server could not find the requested resource (get nodes.metrics.k8s.io)","time":"2021-04-02T03:08:37Z"} 10.244.3.1 - - [02/Apr/2021:03:08:43 +0000] "GET / HTTP/1.1" 200 6 "" "kube-probe/1.17" 10.244.3.1 - - [02/Apr/2021:03:08:53 +0000] "GET / HTTP/1.1" 200 6 "" "kube-probe/1.17" 10.244.3.1 - - [02/Apr/2021:03:09:03 +0000] "GET / HTTP/1.1" 200 6 "" "kube-probe/1.17" 10.244.3.1 - - [02/Apr/2021:03:09:13 +0000] "GET / HTTP/1.1" 200 6 "" "kube-probe/1.17" 10.244.3.1 - - [02/Apr/2021:03:09:23 +0000] "GET / HTTP/1.1" 200 6 "" "kube-probe/1.17" 10.244.3.1 - - [02/Apr/2021:03:09:33 +0000] "GET / HTTP/1.1" 200 6 "" "kube-probe/1.17" {"level":"error","msg":"Error scraping node metrics: the server could not find the requested resource (get nodes.metrics.k8s.io)","time":"2021-04-02T03:09:37Z"} 10.244.3.1 - - [02/Apr/2021:03:09:43 +0000] "GET / HTTP/1.1" 200 6 "" "kube-probe/1.17" 10.244.3.1 - - [02/Apr/2021:03:09:53 +0000] "GET / HTTP/1.1" 200 6 "" "kube-probe/1.17" 10.244.3.1 - - [02/Apr/2021:03:10:03 +0000] "GET / HTTP/1.1" 200 6 "" "kube-probe/1.17"
CoreDNS-1.6.7 linux/amd64, go1.11.13, [ERROR] plugin/errors: 2 8394951512814544912.6071282659909611956.cluster.local. HINFO: dial tcp 10.233.0.3:53: connect: connection refused [ERROR] plugin/errors: 2 224443507692801370.8438177878031430590.ip6.arpa. HINFO: dial tcp 10.233.0.3:53: connect: connection refused [ERROR] plugin/errors: 2 3653121614186441108.1781202264740381226.in-addr.arpa. HINFO: dial tcp 10.233.0.3:53: connect: connection refused ==== END logs for container node-cache of pod kube-system/nodelocaldns-r69s2 ==== ==== START logs for container node-cache of pod kube-system/nodelocaldns-xq59b ==== 2021/03/23 10:42:21 [INFO] Using Corefile /etc/coredns/Corefile 2021/03/23 10:42:21 [ERROR] Failed to read node-cache coreFile /etc/coredns/Corefile.base - open /etc/coredns/Corefile.base: no such file or directory 2021/03/23 10:42:21 [ERROR] Failed to sync kube-dns config directory /etc/kube-dns, err: lstat /etc/kube-dns: no such file or directory 2021/03/23 10:42:21 [INFO] Added back nodelocaldns rule - {raw PREROUTING [-p tcp -d 169.254.25.10 --dport 53 -j NOTRACK]} 2021/03/23 10:42:21 [INFO] Added back nodelocaldns rule - {raw PREROUTING [-p udp -d 169.254.25.10 --dport 53 -j NOTRACK]} 2021/0
Kubeconfig: Quite often the problems are caused by malformed kubeconfig which the application tries to load. Please share your kubeconfig, remember to remove any secret and sensitive information. // don't think it's this as I'm able to connect via kubectl to my clusters without issue
Additional context N/A