 rmartinho
commented
9 years ago
rmartinho
commented
9 years ago The build server cannot build this PR because the author is not whitelisted. A meatbag will have to look at it.
This is an automated message.
Closed bagobor closed 9 years ago
rmartinho
commented
9 years ago The build server cannot build this PR because the author is not whitelisted. A meatbag will have to look at it.
This is an automated message.
 sehe
commented
9 years ago
sehe
commented
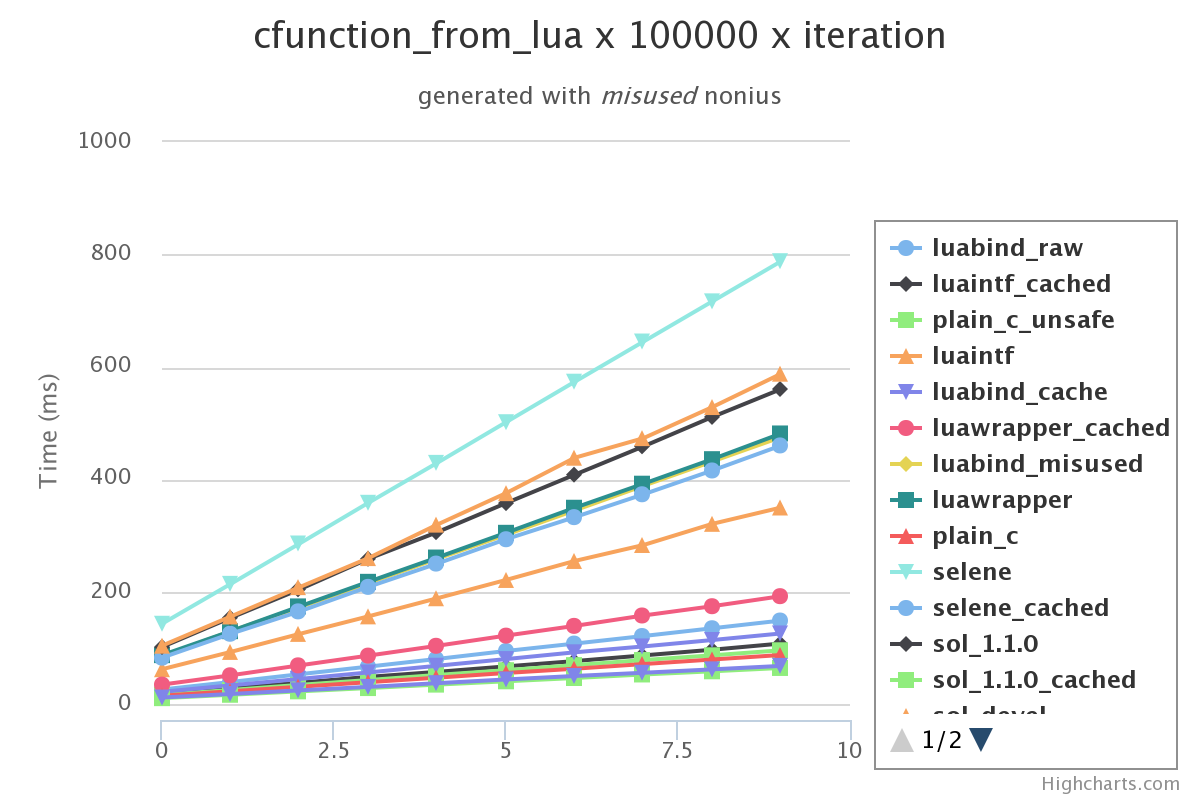
9 years ago What is the use of having a line type to represent discrete samples?
Having the lines, to me, will mean that the visual information is dominated by non-relevant noise (the line segments).
All the slopes are completely useless - unless you know expect trends and (significant) temporal relation in timings. In that case, nonius is not the tool for that.
 bagobor
commented
9 years ago
bagobor
commented
9 years ago 2 reasons for pull request:
Example:
sehe
commented
9 years ago I'm confused. How would you expect to find trends in fairly sampled repeated operations...
Unless I'm misunderstanding the purpose of Nonius, that's not a sound way to use the framework. For example, in the example diagram, what does the X-axis represent?
bagobor
commented
9 years ago ^) Its a little bit tricky:
            , nonius::benchmark("luabind_cache", [luabind_L] {
                static size_t iteration_index = 1;
                ...
                for (size_t i = 0, end = NUM_ITERATIONS*iteration_index; i < end; ++i) {
                    ...
                }
                ++iteration_index;
                return result;
})@bagobor That's what I expected you were doing indeed. You're "subverting" the statistical analysis and doing comparative benchmarking, using varying parameters. Doing it like this is certainly not the intended purpose.
I think the author was /planning/ to implement such a feature, let's hear what he has to say :)
Cheers
bagobor
commented
9 years ago @sehe Currently I only need rough estimation. Not statically correct measurements.
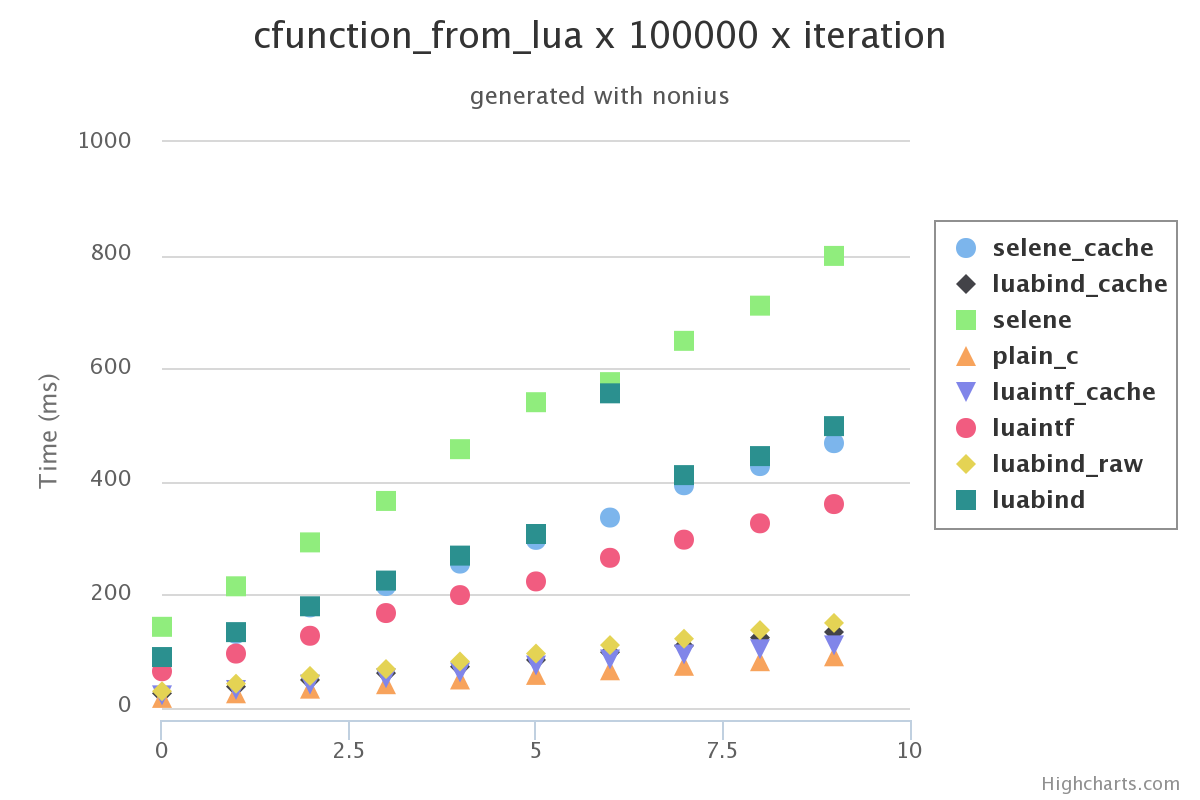
same results in scatter style: https://raw.githubusercontent.com/bagobor/cpp2lua-buindings-battle/master/results/cfunction_from_lua_scatter.png
rmartinho
commented
9 years ago 2 reasons for pull request:
Before anything else... N reasons for N pull requests please.
sehe
commented
9 years ago @bagobor Risking getting chatty here: it's nice that you only need rough estimation, however then you don't need nonius. Just time the things and plot them.
If you post these graphs saying "generated with nonius" people will get the wrong impression and it would be a shame if people massively learn to abuse a good tool only to get "pwetty graphs". Honestly.
I'm bowing out here because I think we understand each other by now. I hope you understand why I cared enough to comment,
Cheers, Seth
rmartinho
commented
9 years ago Now. What you are doing there is just wrong.
Without the carefully crafted statistical measurements, nonius is just a pair of timer calls around user code. There are hundreds of such dumb timer "benchmark frameworks" out there and nonius is expressly not another one, by design. Heck you can just write such a dumb timer yourself; it's trivial.
Varying benchmark parameters is something l will consider adding, but this "a little bit tricky" scenario is definitely not being supported ever.
bagobor
commented
9 years ago @sehe good point. @rmartinho I solving my problem. Sorry if I not right user for your code :) But it helps me a little bit and I thankful for that. :+1: Currently you library have no option to obtain statistical stable result with increasing number of samples. So here we are. :)
highchart updated + graph type changed to line