loosolab / TOBIAS

Transcription factor Occupancy prediction By Investigation of ATAC-seq Signal
MIT License
193 stars 41 forks source link

Questions on PlotAggregate #66

Closed hero-outman closed 3 years ago

hero-outman commented 3 years ago

Hello, msbentsen, I have some questions when using TOBIAS for my ATAC-seq data analysis, I read the docs on TOBIAS Github, but still confused. My atac-seq analysis propose is finding different TFBS motifs of A549 cell line between conditionA and conditionB; And my analysis route like:

Next, I use TOBIAS for TF footprint analysis; after 
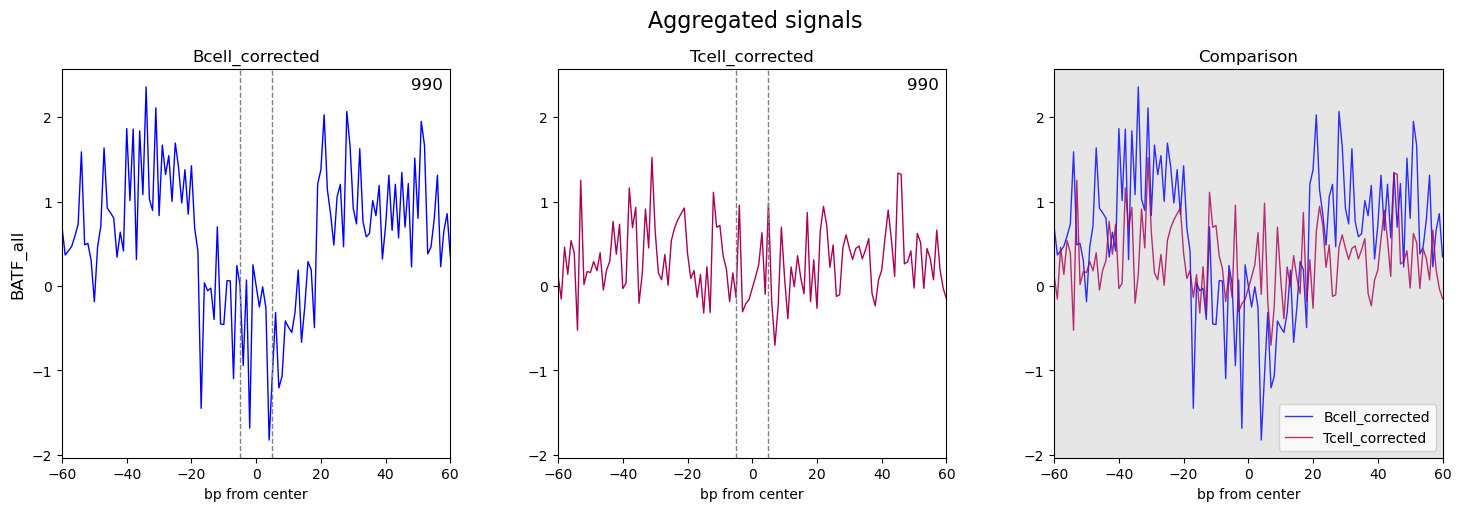
ATACorrect --> ScoreBigwig --> BINDetect --> PlotAggregate, I got my results, seems not the expected one(no obviously footprint on the aggregate plot on most enriched motif). Here are my aggregate plots: image compare to your example pic, it's quite a different: image

Also, I made an aggregate plot between uncorrected and corrected, still not expected(the curve shape of uncorrected and corrected are very same, just one position higher than another on the Y-axis). Here's the pic: image

I tried for couple of days, still cannot get a good plot on each condition.

So I will ask some question based on the information above:

  1. The result of scorebigwig(footprint.bw) and bindetect(TFBS.bed files) fit my expected result. But why aggregate-plot won't show a 'good-shaped' footprint plot? If aggregate-plot is not good, can I still rely on footprint.bw and TFBS.bed files?

  2. I have conditionA and B .narrowpaek for the whole peak of two conditions, also uniq_open_A and B .bed for unique open regions(a subset of the whole peak), which kind of peak should I use in:

    • ATACorrect --peaks
    • ScoreBigwig --regions
    • BINDetect --peaks I tried both(whole peak and unique open peak), but cannot get a 'good' aggregate plot
  3. In aggregate plot: the plot curve between corrected.bw and uncorrected.bw, why their shape is so same, and just different position on Y-axis(not like figures in TOBIAS paper and GitHub), does this mean my correction won't work? Please see pics above; My ATACorrect code is

    TOBIAS ATACorrect \
    --bam conditionA.bam \
    --genome $hg38_path \
    --peaks uniq_open_A.bed \
    --blacklist $blacklist_path \
    --outdir ATACorrect_out \
    --cores 20
  4. When plotting aggregate footprint, I try to use --smooth 3 or 5, with this param, I can get a 'better' footprint plot, does this try make sense? Here is the smoothed pic: image

  5. in PlotAggregate method, What is the difference between these two arguments: --regions and --whitelist

Hope you can give me some advice, thanks.

msbentsen commented 3 years ago

Hi,

Thank you for reaching out! I will try to answer your questions in the order as listed:

  1. Not all TF's show nice footprints in aggregate plots - this is because not all TF's have the same ability to protect against Tn5 cleavage, not all TF's bind the DNA long enough etc. But you can still rely on the footprints.bw and .bed-files because the score is calculated as a merge of accessibility and footprint ability.
  2. For all three tools, you should use a merge of conditionA + conditionB narrowpeaks. You can easily make this with $ cat condition*.narrowpeak | bedtools sort | bedtools merge > merged_peaks.bed. So even for the condition A run, the peaks should also contain the peaks from condition B to ensure that the normalization is equal.
  3. I think the issue here is that the input --peaksare only the unique A peaks (and it should be all peaks from both conditions, as explained in 2.). Can you try to run it with the merge of all condition peaks? This will increase the number of regions, and I also believe the bias correction will be better. You can also check the output of the bias correction in the output .pdf-file of ATACorrect.
  4. You can benefit from smoothing the footprint if there are a lot of single-bp peaks in the footprint (e.g. few positions creating spikes in the profile). Essentially, you are taking some of the resolution away to possibly catch a more general shape. So if that works better for you, I don't see any issue in playing around with --smooth.
  5. The difference is that you can give several --regions-files, which will then create subsets of the input e.g. "TFBS overlapping regions1.bed" and "TFBS overlapping regions2.bed". This is useful for checking the footprints within different sets of peaks. In your case, you could for example try --regions uniq_open_A.bed uniq_open_B.bed. The --whitelist will simply exclude any sites not within whitelist. But you are right, that for one regions file, --regions is technically the same as --whitelist.

I hope this helps you out!

Best, Mette

hero-outman commented 3 years ago

Hi msbentsen,

Thank you so much for answering my long question! Really helps me a lot! I will re-work this on next Monday(can not reach the server from home) and tell the result.

Best Chu

hero-outman commented 3 years ago

Hi msbentsen, So many thanks for your previous help. I merged conditionA.narrowpeak also B to conditionA_conditionB_merged_narrowpeak.bed, and performed ATACorrect to correct Tn5 bias. The result of aggregate_plot is still the same as the former situation(in which curve shapes are the same but just different on the height of the y-axis). I paste the code and plot also log file here, hope can get some advice from you.

Best Chu

ATACorrect log:

# TOBIAS 0.12.10 ATACorrect (run started 2021-04-20 13:48:52.132628)
# Command line call: TOBIAS ATACorrect --bam conditionB.merged.sorted.bam --genome hg38.fa --peaks conditionA_conditionB_merged_narrowpeak.bed --blacklist hg38-blacklist.v2.bed --outdir outdir --cores 20

# ----- Input parameters -----
# bam:  conditionB.merged.sorted.bam
# genome:    hg38.fa
# peaks:    conditionA_conditionB_merged_narrowpeak.bed
# regions_in:   None
# regions_out:  None
# blacklist:    hg38-blacklist.v2.bed
# extend:   100
# split_strands:    False
# norm_off: False
# track_off:    []
# k_flank:  12
# read_shift:   [4, -5]
# bg_shift: 100
# window:   100
# score_mat:    DWM
# prefix:   conditionB.merged.sorted
# outdir:   our_dir
# cores:    20
# split:    100
# verbosity:    3

# ----- Output files -----
# conditionB.merged.sorted_uncorrected.bw
# conditionB.merged.sorted_bias.bw
# conditionB.merged.sorted_expected.bw
# conditionB.merged.sorted_corrected.bw
# conditionB.merged.sorted_atacorrect.pdf

2021-04-20 13:48:52 (69790) [INFO]  ----- Processing input data -----
2021-04-20 13:48:52 (69790) [INFO]  Reading info from .bam file
2021-04-20 13:48:52 (69790) [INFO]  Reading info from .fasta file
2021-04-20 13:48:52 (69790) [INFO]  Processing input/output regions
2021-04-20 13:48:59 (69790) [STATS] genome: 24 regions | 3088269832 bp | 100.00% coverage
2021-04-20 13:48:59 (69790) [STATS] input_regions: 141929 regions | 2803703061 bp | 90.79% coverage
2021-04-20 13:48:59 (69790) [STATS] output_regions: 111232 regions | 80237069 bp | 2.60% coverage
2021-04-20 13:48:59 (69790) [STATS] peak_regions: 114446 regions | 57404371 bp | 1.86% coverage
2021-04-20 13:48:59 (69790) [STATS] nonpeak_regions: 141929 regions | 2803703061 bp | 90.79% coverage
2021-04-20 13:48:59 (69790) [STATS] blacklist_regions: 636 regions | 227162400 bp | 7.36% coverage

2021-04-20 13:48:59 (69790) [INFO]  ----- Estimating normalization factors -----
2021-04-20 13:48:59 (69790) [INFO]  Counting reads in peak regions
2021-04-20 13:49:37 (69790) [INFO]  Progress: 100%

2021-04-20 13:49:37 (69790) [INFO]  Counting reads in nonpeak regions
2021-04-20 13:50:07 (69790) [INFO]  Progress: 100%
2021-04-20 13:50:07 (69790) [STATS] TOTAL_READS 65920830
2021-04-20 13:50:07 (69790) [STATS] PEAK_READS  34734967
2021-04-20 13:50:07 (69790) [STATS] NONPEAK_READS   31185863
2021-04-20 13:50:07 (69790) [STATS] LIB_NORM    0.15170
2021-04-20 13:50:07 (69790) [STATS] FRiP    0.52692
2021-04-20 13:50:07 (69790) [STATS] CORRECTION_FACTOR:  0.28789

2021-04-20 13:50:07 (69790) [INFO]  Started estimation of sequence bias...
2021-04-20 13:50:08 (69790) [INFO]  Progress: ...
2021-04-20 13:50:55 (69790) [INFO]  Finalizing bias motif for scoring

2021-04-20 13:50:56 (69790) [INFO]  ----- Correcting reads from .bam within output regions -----
2021-04-20 13:50:57 (69790) [INFO]  Correction progress:...
2021-04-20 14:04:33 (70953) [INFO]  Closing conditionB.merged.sorted_uncorrected.bw (this might take some time)
2021-04-20 14:04:33 (69790) [INFO]  Correction progress: done!
2021-04-20 14:04:33 (70955) [INFO]  Closing conditionB.merged.sorted_bias.bw (this might take some time)
2021-04-20 14:04:40 (70953) [INFO]  Closing conditionB.merged.sorted_expected.bw (this might take some time)
2021-04-20 14:04:58 (70955) [INFO]  Closing conditionB.merged.sorted_corrected.bw (this might take some time)

2021-04-20 14:05:21 (69790) [INFO]  Verifying bias correction
2021-04-20 14:05:21 (69790) [STATS] BIAS    pre-bias variance forward:  0.0000001
2021-04-20 14:05:21 (69790) [STATS] BIAS    post-bias variance forward: 0.0000000
2021-04-20 14:05:22 (69790) [STATS] BIAS    pre-bias variance reverse:  0.0000001
2021-04-20 14:05:22 (69790) [STATS] BIAS    post-bias variance reverse: 0.0000000

2021-04-20 14:05:22 (69790) [INFO]  Finished ATACorrect run (total time elapsed: 0:16:30.459222)

part of pdf result: before correct image

after correct image

ag_plot image

msbentsen commented 3 years ago

Hi hero-outman,

Thank you for the update and for the log! I am looking at the Tn5 insertion bias figure, and it is looking a little strange. For ATAC-seq, the bias usually looks like: tn5

Where you can clearly see the dimeric Tn5 motif. However, yours looks a bit random.

Can you give some more background information on the data you are using? Were the reads shifted or otherwise perturbed in some way? It is looking like the reads do not have the Tn5 signature - i.e. not looking like ATAC-seq.

hero-outman commented 3 years ago

Hi msbentsen: So many thanks for your reply. Our experiment design is: find different chromosome open and close situation of A549 cell line between the treatment of 2 compounds A and B, so we performed pair-end ATAC-seq, read length is 150bp. My data process workflows like this:

  1. use Trimmomatic to trim Illumina Nextera Tn5 adaptor which reported by Fastqc;
  2. align to hg38 by bowtie2 with param --very-sensitive --no-unal --no-mixed --no-discordant -X2000;
  3. remove dups and chrM|chrUn|random|RANDOM ;
  4. convert .bam to .bed by bedtools with param like bamtobed -mate1 -bedpe
  5. then remove black_list_region by bedtools intersect -v -a $reads.bed -b $black_list_file before peak calling;
  6. peakcalling by macs2 callpeak -q 0.05 -t read.blacklist.removed.bed -g hs -f BEDPE --bdg --outdir outdir. got conditionA.narrowpeak and conditionB.narrowpeak;
  7. then perform diff-peak analysis, and got uniq_open_in_A.bed and uniq_open_in_B.bed;
  8. use uniq_open_in_A.bed and uniq_open_in_B.bed perform Homer denovo motif finding: findMotifsGenome.pl uniq_open_in_A.bed hg38 -mask; till here, our chip-seq based on homer motif result and RNA seq data is ongoing, and I want to use TOBIAS perform TFs footprint analysis to get some results that can fit the trend.

I also perform insert size analysis by deeptools and got the plot, I think they followed ATAC-seq fragments distribution pattern: image image

Also, the motifs got from the unique open region and their peak annotation fit our RNA seq data. I merged conditionA.narrowpeak and conditionA.narrowpeak and use conditionA.read.bam and conditionB.read.bam respectively for ATACorrect.

Please give me some hints, thanks!

Best regards Chu

msbentsen commented 3 years ago

Hi Chu,

I think your workflow looks good. The only thing I think looks a little strange is the lack of fragments of size ~150-160 as seen here: image But I am not sure how that would influence the footprinting. I am really sorry, but I am not quite sure what to do here. The only thing I imagine is if you could share with me a subset of the reads (for example one chromosome of one condition) - then I can have a look if there might be something special not taken into account by ATACorrect. Let me know if that would be possible.

Best regards, Mette

hero-outman commented 3 years ago

Hi msbentsen:

I extract Chr4 reads from .bam of conditionA and conditionB, and upload them to Zenodo. I think you can download from https://zenodo.org/record/4722761#.YIfTwZMzaBR

Many thanks, Chu

msbentsen commented 3 years ago

Hi Chu, Thank you for sharing the files! The odd thing is - I can't reproduce your initial results. My steps were as follows:

$ macs2 callpeak -t conditionA.chr4.bam --name conditionA
$ macs2 callpeak -t conditionB.chr4.bam --name conditionB
$ cat condition*_peaks.narrowPeak | bedtools sort | bedtools merge > conditionAB_peaks.bed
$ TOBIAS ATACorrect --bam conditionA.chr4.bam --peaks conditionAB_peaks.bed --genome homo_sapiens.101.fa --cores 10

With this, I get the expected Tn5 motif as seen above. Can you please confirm whether you still see the same "random" pattern with the chr4 test data? In that case, there might be an issue with your hg38.fa file not matching the .bam-file reads.

Best regards, Mette

hero-outman commented 3 years ago

Hi msbentsen:

I think you are right, it's my hg38 issue. I changed hg38.fa and performed ATACorrect again, got the clearly Tn5 motif. image

Thank you so much for the patience help, and may the force be with you!

Best Chu

msbentsen commented 3 years ago

Great, I'm glad we got it solved in the end! I'm closing this issue but feel free to open another in case of other questions.