Open philCryoport opened 6 years ago
Hi there,
I'm completely new to the R language (lots of prior experience with Java, PHP, Scala, HTML, CSS, shell scripting).
I'm trying to build a cause and effect / ishikawa diagram with sub-branches. The real ishikawa diagram is going to go down 5 levels in some cases.
I'm trying to adapt an example I found at https://gist.github.com/normansimonr/d52ffd5937f1a5095a0a but I'm having difficulty creating a sub-branch:
library(qcc)
cause.and.effect(
  cause=list(
    INGREDIENTS = c("Coffee", "Sugar", "Water")
    ,PEOPLE = c("You")
    ,ENERGY = list(
      FOSSIL_FUELS=c("Gas","Coal","Wood")
      ,RENEWABLES=c("Solar","Geothermal")
      )
    ,TOOLS = c("Spoon", "Cooker", "Cup")
  )
  ,effect="A cup of coffee"
  ,title="Fishbone chart for a cup of coffee"
)
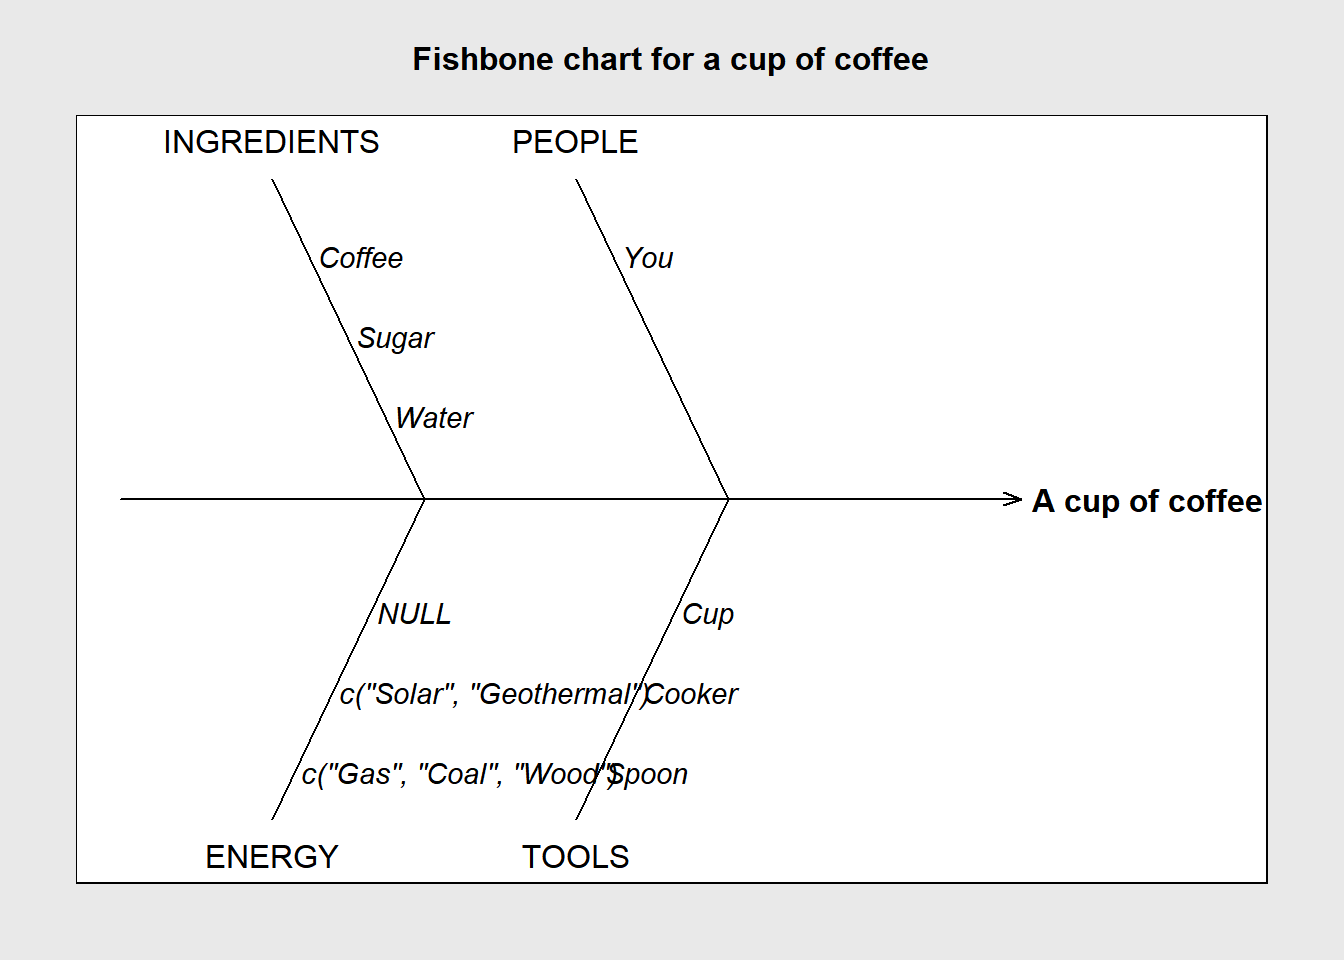
This modified version results in:
I also tried:
library(qcc)
cause.and.effect(
  cause=list(
    INGREDIENTS = c("Coffee", "Sugar", "Water")
    ,PEOPLE = c("You")
    ,cause.and.effect(cause=list(
      FOSSIL_FUELS=c("Gas","Coal","Wood")
      ,RENEWABLES=c("Solar","Geothermal")
      ),
      effect="ENERGY")
    ,TOOLS = c("Spoon", "Cooker", "Cup")
  )
  ,effect="A cup of coffee"
  ,title="Fishbone chart for a cup of coffee"
)
But that threw the following error:
Error in if (!is.na(label)) text(x[i], y[i], label, pos = 4, offset = 0.2,  :
  argument is of length zero
Calls: <Anonymous> ... withCallingHandlers -> withVisible -> eval -> eval -> cause.and.effect
How do I instead get sub-branches of the ENERGY branch:
?
Your help is much appreciated!
Thanks,
/Phil
Hi there,
I'm completely new to the R language (lots of prior experience with Java, PHP, Scala, HTML, CSS, shell scripting).
I'm trying to build a cause and effect / ishikawa diagram with sub-branches. The real ishikawa diagram is going to go down 5 levels in some cases.
I'm trying to adapt an example I found at https://gist.github.com/normansimonr/d52ffd5937f1a5095a0a but I'm having difficulty creating a sub-branch:
This modified version results in:
I also tried:
But that threw the following error:
How do I instead get sub-branches of the ENERGY branch:
?
Your help is much appreciated!
Thanks,
/Phil