lzh2nix / articles

用 issue 来管理个人博客
https://github.com/lzh2nix/articles
61 stars 13 forks source link

golang 强筋壮骨系列之 Tools/Diagnostics(中级) #77

Open lzh2nix opened 4 years ago

lzh2nix commented 4 years ago

目录

An Overview of Go's Tooling(2020.08.25) Profiling Go Programs(2020.08.26) Using Go as a scripting language in Linux(2020.08.27) Profiling and optimizing Go web applications(2020.08.28) Diagnostics(2020.08.29) Five things that make Go fast(2020.08.29) Practical Go Benchmarks(2020.08.29)

lzh2nix commented 4 years ago

golang tools简介(2020.08.25)

原文: https://www.alexedwards.net/blog/an-overview-of-go-tooling

这不是简介这是十全大补丸

具体的check sheet https://github.com/fedir/go-tooling-cheat-sheet/blob/master/go-tooling-cheat-sheet.pdf

里面附带的几篇文章也是超级好: Profiling and optimizing Go web applications Debugging performance issues in Go programs Daily code optimization using benchmarks and profiling Profiling Go programs with pprof go tool trace

lzh2nix commented 4 years ago

Profiling Go Programs(2020.08.26)

原文: https://blog.golang.org/pprof

官方出品而且是 Russ Cox 写的,havlak1cc.go 那个文件挺复杂的,没有太详细的去看,这里关注的是怎么使用go pprof找到性能瓶颈+优化思路。

普通程序添加cpu profile

var cpuprofile = flag.String("cpuprofile", "", "write cpu profile to file")

func main() {
    flag.Parse()
    if *cpuprofile != "" {
        f, err := os.Create(*cpuprofile)
        if err != nil {
            log.Fatal(err)
        }
        pprof.StartCPUProfile(f)
        defer pprof.StopCPUProfile()
    }

cpu profile 解析

$ go tool pprof havlak1 havlak1.prof
(pprof) top10
Total: 2525 samples
     298  11.8%  11.8%      345  13.7% runtime.mapaccess1_fast64
     268  10.6%  22.4%     2124  84.1% main.FindLoops
     251   9.9%  32.4%      451  17.9% scanblock
     178   7.0%  39.4%      351  13.9% hash_insert
     131   5.2%  44.6%      158   6.3% sweepspan
     119   4.7%  49.3%      350  13.9% main.DFS
      96   3.8%  53.1%       98   3.9% flushptrbuf
      95   3.8%  56.9%       95   3.8% runtime.aeshash64
      95   3.8%  60.6%      101   4.0% runtime.settype_flush
      88   3.5%  64.1%      988  39.1% runtime.mallocgc

golang一秒采样100次左右

第一列/第二列表示在采样的出现的次数和占比, 比如 runtime.mallocgc 在整个2525次采样中出现了88次站比3.5%

第三列其实就是第二列的累加值,表示top N的占比

第四列/第五列表示该函数在采样中出现的次数, 比如runtime.mallocgc和988个sample相关,占比达到了39%

各个函数之间的调用关系可以通过图的形式查看:

查看代码

(pprof) list DFS
Total: 2525 samples
ROUTINE ====================== main.DFS in /home/rsc/g/benchgraffiti/havlak/havlak1.go
   119    697 Total samples (flat / cumulative)
     3      3  240: func DFS(currentNode *BasicBlock, nodes []*UnionFindNode, number map[*BasicBlock]int, last []int, current int) int {
     1      1  241:     nodes[current].Init(currentNode, current)
     1     37  242:     number[currentNode] = current
     .      .  243:
     1      1  244:     lastid := current
    89     89  245:     for _, target := range currentNode.OutEdges {
     9    152  246:             if number[target] == unvisited {
     7    354  247:                     lastid = DFS(target, nodes, number, last, lastid+1)
     .      .  248:             }
     .      .  249:     }
     7     59  250:     last[number[currentNode]] = lastid
     1      1  251:     return lastid
(pprof)

开启内存 profile

var memprofile = flag.String("memprofile", "", "write memory profile to this file")
...

    FindHavlakLoops(cfgraph, lsgraph)
    if *memprofile != "" {
        f, err := os.Create(*memprofile)
        if err != nil {
            log.Fatal(err)
        }
        pprof.WriteHeapProfile(f)
        f.Close()
        return
    }

在生成图的时候drop掉占比低的节点

$ go tool pprof --nodefraction=0.1 havlak4 havlak4.prof
Welcome to pprof!  For help, type 'help'.
(pprof) web mallocgc

http server 开启profile

在main.go 中 import _ "net/http/pprof"

然后直接:

go tool pprof http://localhost:6060/debug/pprof/profile   # 30-second CPU profile
go tool pprof http://localhost:6060/debug/pprof/heap      # heap profile
go tool pprof http://localhost:6060/debug/pprof/block     # goroutine blocking profile

整体的优化思路是: map--->slice-->cache 数据结构越简单越高效,尽量减少GC是优化之道

lzh2nix commented 4 years ago

go作为linux下的脚本语言(2020.08.27)

原文:https://blog.cloudflare.com/using-go-as-a-scripting-language-in-linux/

主要介绍了基于 gorun 的 golang 脚本运行方式。本文最大特点是介绍了一种通过 linux binfmt_misc 来直接脚本的方式

  1. check binfmt_misc 已经挂载

    $ mount | grep binfmt_misc
    systemd-1 on /proc/sys/fs/binfmt_misc type autofs (rw,relatime,fd=27,pgrp=1,timeout=0,minproto=5,maxproto=5,direct)
  2. 将build好的 gorun 放到 /user/local/bin/下

  3. .go 文件指定用gorun解析

    $ echo ':golang:E::go::/usr/local/bin/gorun:OC' | sudo tee /proc/sys/fs/binfmt_misc/register
    :golang:E::go::/usr/local/bin/gorun:OC

    可以直接执行.go文件了

    $ chmod u+x helloscript.go
    $ ./helloscript.go
    Hello, world!
lzh2nix commented 4 years ago

分析和优化go web 应用(2020.08.28)

原文: https://artem.krylysov.com/blog/2017/03/13/profiling-and-optimizing-go-web-applications/

使用工具基本和前面的一致, 对http server使用ab test进行测试然后使用go tool pprof xxx 进行性能分析。

指定 alloc_objects|inuse_objects 进行内存分配的分析

go tool pprof -alloc_objects http://127.0.0.1:8080/debug/pprof/heap

内存分配的benchmark:

go test -bench=. -benchmem

benchcmp 进行性能分析比对:

go test -run=NONE -bench=. ./... > old.txt
# make changes
go test -run=NONE -bench=. ./... > new.txt

然后:

benchcmp old.txt new.txt

优化建议:

vs

func leftpad(s string, length int, char rune) string { buf := bytes.Buffer{} for i := 0; i < length-len(s); i++ { buf.WriteRune(char) } buf.WriteString(s) return buf.String() }

- 尽量使用pass by pointer
- 如果知道map,slice的大小的话早点分配
- 避免log输出(每次输出都是一次io操作,很耗时)
- 顺序读写的场景使用bytes.Buffer{}
```golang
func (s *StatsD) Send(stat string, kind string, delta float64) {
    buf := fmt.Sprintf("%s.", s.Namespace)
    trimmedStat := strings.NewReplacer(":", "_", "|", "_", "@", "_").Replace(stat)
    buf += fmt.Sprintf("%s:%s|%s", trimmedStat, delta, kind)
    if s.SampleRate != 0 && s.SampleRate < 1 {
        buf += fmt.Sprintf("|@%s", strconv.FormatFloat(s.SampleRate, 'f', -1, 64))
    }
    ioutil.Discard.Write([]byte(buf)) // TODO: Write to a socket
}

vs 

func (s *StatsD) Send(stat string, kind string, delta float64) {
    buf := bytes.Buffer{}
    buf.WriteString(s.Namespace)
    buf.WriteByte('.')
    buf.WriteString(reservedReplacer.Replace(stat))
    buf.WriteByte(':')
    buf.Write(strconv.AppendFloat(make([]byte, 0, 24), delta, 'f', -1, 64))
    buf.WriteByte('|')
    buf.WriteString(kind)
    if s.SampleRate != 0 && s.SampleRate < 1 {
        buf.WriteString("|@")
        buf.Write(strconv.AppendFloat(make([]byte, 0, 24), s.SampleRate, 'f', -1, 64))
    }
    buf.WriteTo(ioutil.Discard) // TODO: Write to a socket
}
lzh2nix commented 4 years ago

chrome 打开 http://127.0.0.1:43591/trace 一片空白的解决方法: 关闭所有的chrome然后使用下面的参数打开

google-chrome --enable-blink-features=ShadowDOMV0,CustomElementsV0,HTMLImports

lzh2nix commented 4 years ago

诊断(2020.08.29)

原文: https://golang.org/doc/diagnostics.html

官方一篇关于go tools的介绍性的文章,分别对Profile, Tracing,Debuging,Runtime statistics and events 进行了简单的介绍

Profile

这个可能是最常用的分析工具, 打开/debug/pprof 就可以看到如下的输出: image

本来打算使用emitter来做一下这里的演示的,结果用了他的client发现一个bug, 然后就喜提一个PR https://github.com/emitter-io/go/pull/28.

image

一般通过 allocs/block/goroutine/mutex这几个的链接可以看出大概的的性能瓶颈在哪里了,然后再可以通过go tool pprof http://127.0.0.1:8080/debug/pprof/allocs 可以做进一步的分析,这里的话就比较直观一点。

trace

也是第一次接触, 不过里面有几个特性确实不错,点击上面/debug/pprof的trace可以用生成trace文件,然后使用 go tool trace trace 进行加载,直接view trace的话貌似看不出山东西来,这里的goroutine分析比较有意思 image 
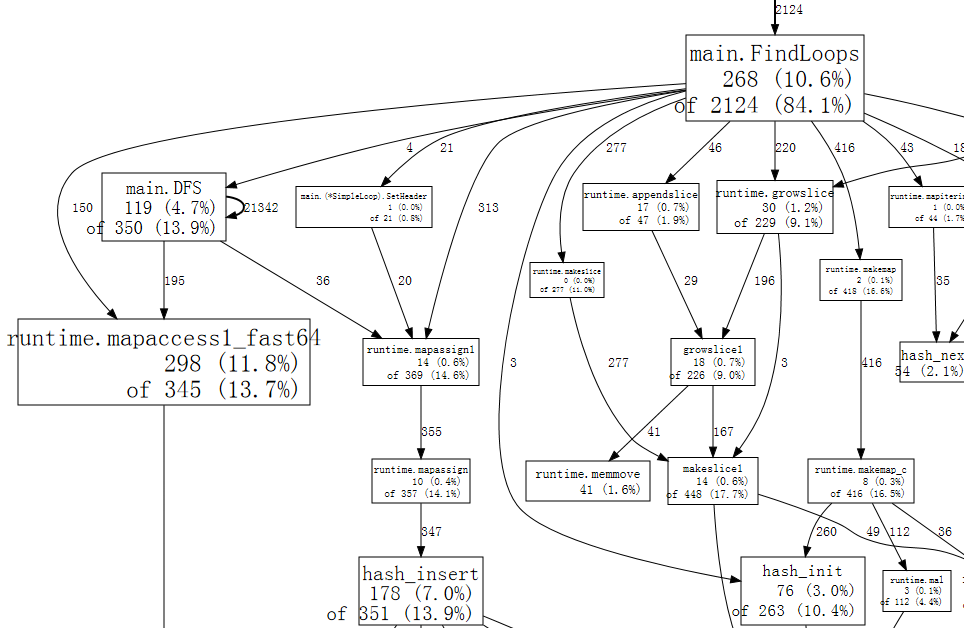
这里可以看到所有goroutine的列表,感觉比pprof里的更直接一点,再点击一层之后可以看到: image 从这里可以看到 在 github.com/emitter-io/emitter/internal/broker.(*Conn).Process 占用了93%的时间, 而这些gourotine大部分时间又是花在了Network Wait 上, 通过最外面一层的Network blocking profile(⬇) 又能看到具体的路径 image 这样去分析问题就快捷很多了。

Debugging

一般都是log + profile 去定位问题,直接dbg/delve单步调试没有操作过。一般问题还可以通过 /debug/pprof/goroutine?debug=2 进行分析, 这里是所有go goutine的callstack dump 再加上这一栏的帮助的话应该轻松很多了。 image

Runtime statistics and events

这些进行一般都是直接入到prometheus, 然后进行监控+分析

lzh2nix commented 4 years ago

5件让golang变快的事情(2020.08.29)

原文: https://dave.cheney.net/2014/06/07/five-things-that-make-go-fast

Dave cheney在GoCon 2014 Tokyo 的一篇演讲。

1. golang的数据存储

由于golang不是基于vm的语言所以在数据结构存储上比python/java对内存友好很多,但是最后一条我不是太认同,尤其是举的最后一个

var Location [1000]Location

Inside the array, the Location structures are stored sequentially, rather than as pointers to 1,000 Location structures stored randomly. 这里数组在所有语言中应该都是连续存储的,并不是golang所独有的特点。

2. inline

为了减少函数调用,将很小的函数直接inline化, 这个应该也是所有语言都有的特性

3. 逃逸分析

逃逸:变量生命周期超过声明的函数 如果没有发生逃逸,这个变量就不用在heap上分配,也就减少了GC的压力。

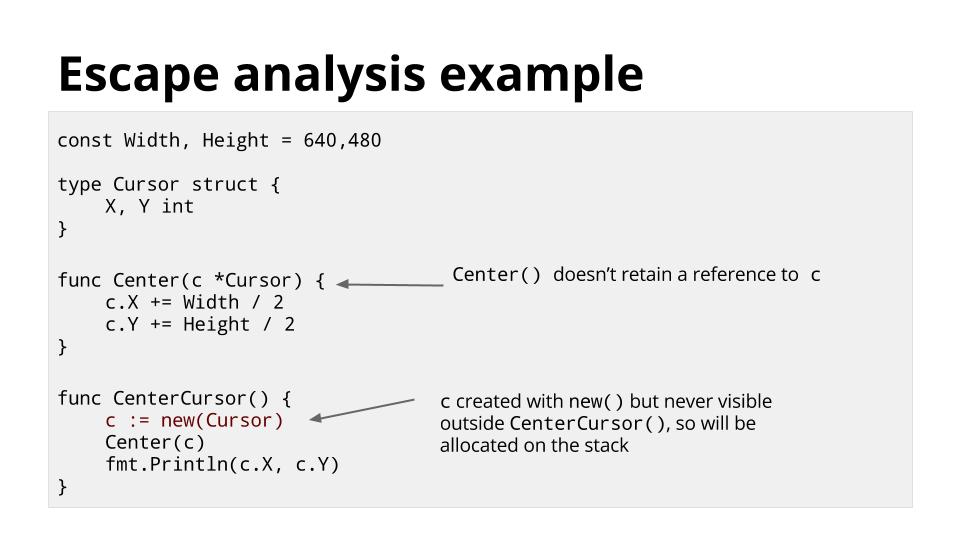
这里c虽然使用了new操作,但是作用域没有超出CenterCursor函数所有还是会在栈上分配。

4. goroutine

yes, 这个才是go 快的最大特定 多进程时代

多线程时代 go routine时代

5. segmented and copying stacks

由于在多线程环境中所有线程都在同一个进程空间里,为了保护一个线程之间相互破坏需要放很多的guard page 
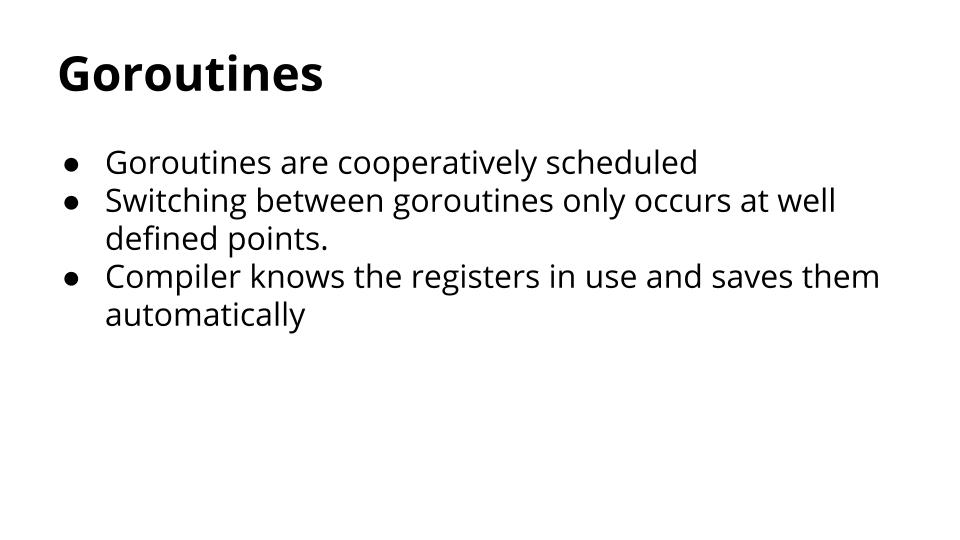
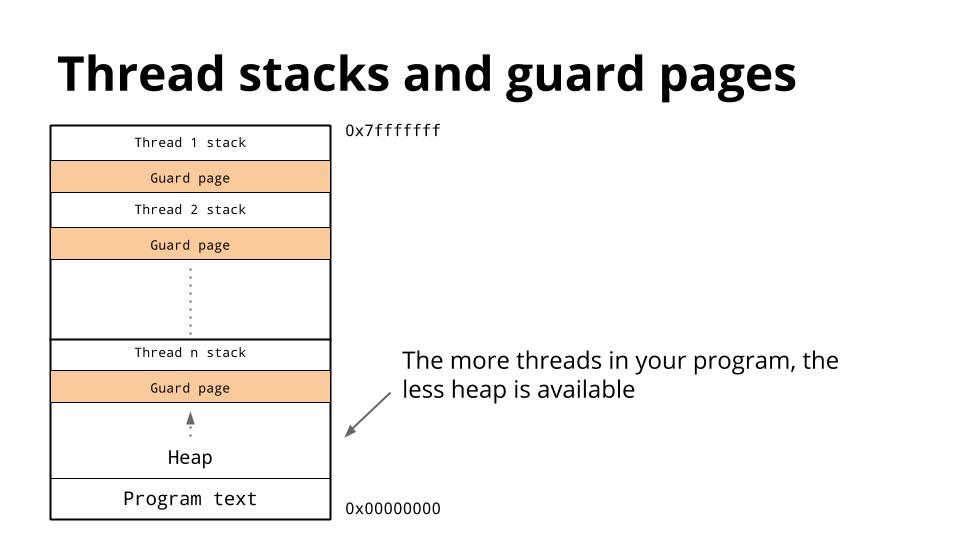
线程越多这个gard page也就越多,这对内存资源来说是很多的浪费。go 在这方面的改进就是没有gard page,初始栈只有8k,然后随着需求的增加可以不断的申请。这里涉及到一个golang的栈管理相关的知识点。 在1.0~1.2中的操作是, 先给他个8k的栈,如果需要更大的空间的时候就新开一个栈,等返回之后把新的栈给释放掉。 
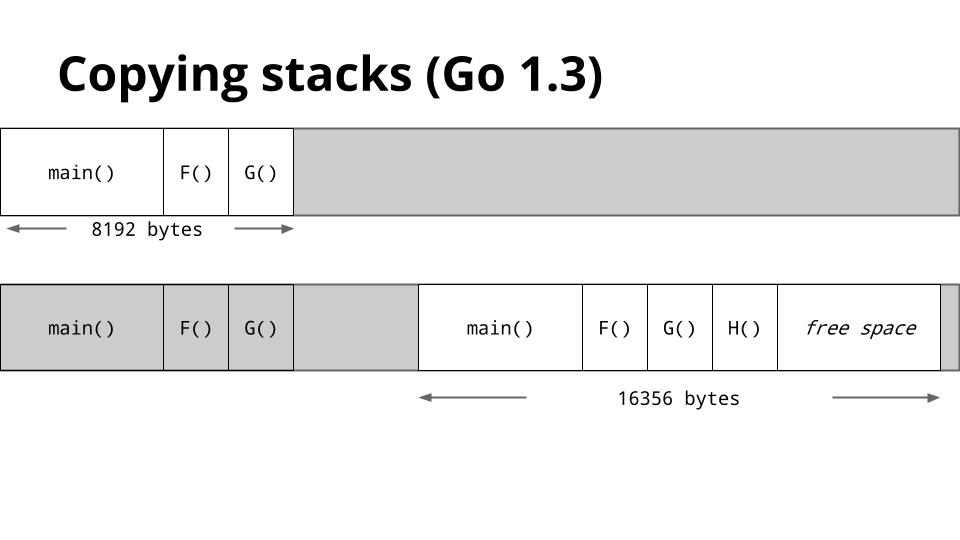
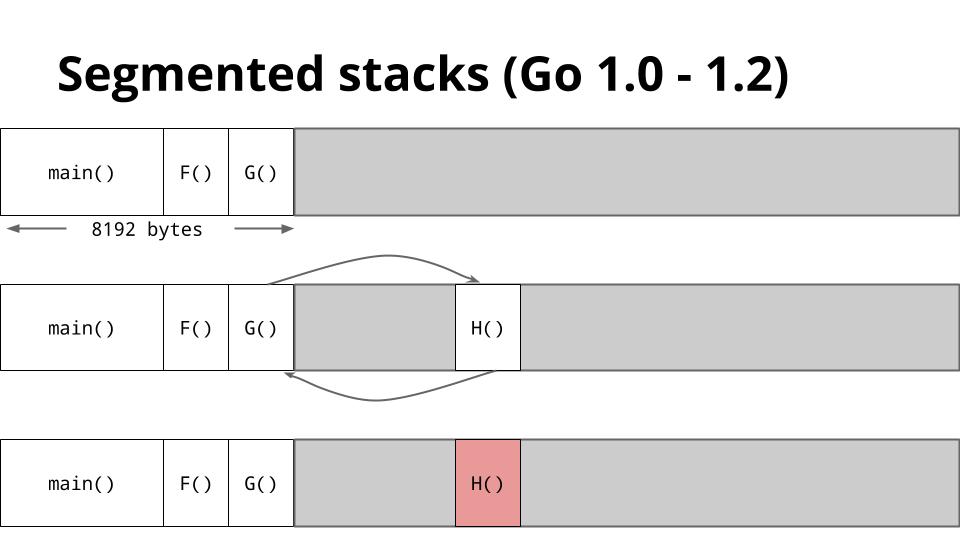
如果有大量的goroutine做申请/释放操作的话就会引起hot split问题, 为了解决这个问题在1.3中引入了copy技术,如果一个goroutine需要更大的栈了就先申请一个更大栈,然后将所有老的栈里的东西拷贝过去,然后在新的栈里执行程序。 详细可以参考

https://blog.cloudflare.com/how-stacks-are-handled-in-go/ https://docs.google.com/document/d/1wAaf1rYoM4S4gtnPh0zOlGzWtrZFQ5suE8qr2sD8uWQ/pub

注: 图片来源于作者博客

lzh2nix commented 4 years ago

golang benchmark实战(2020.08.29)

原文: https://stackimpact.com/blog/practical-golang-benchmarks/

不多说,见过写benchmark最好的文章